Grab Reports Second Quarter 2023 Results
Grab Holdings Limited (NASDAQ: GRAB) today announced unaudited financial results for the second quarter ended June 30, 2023.

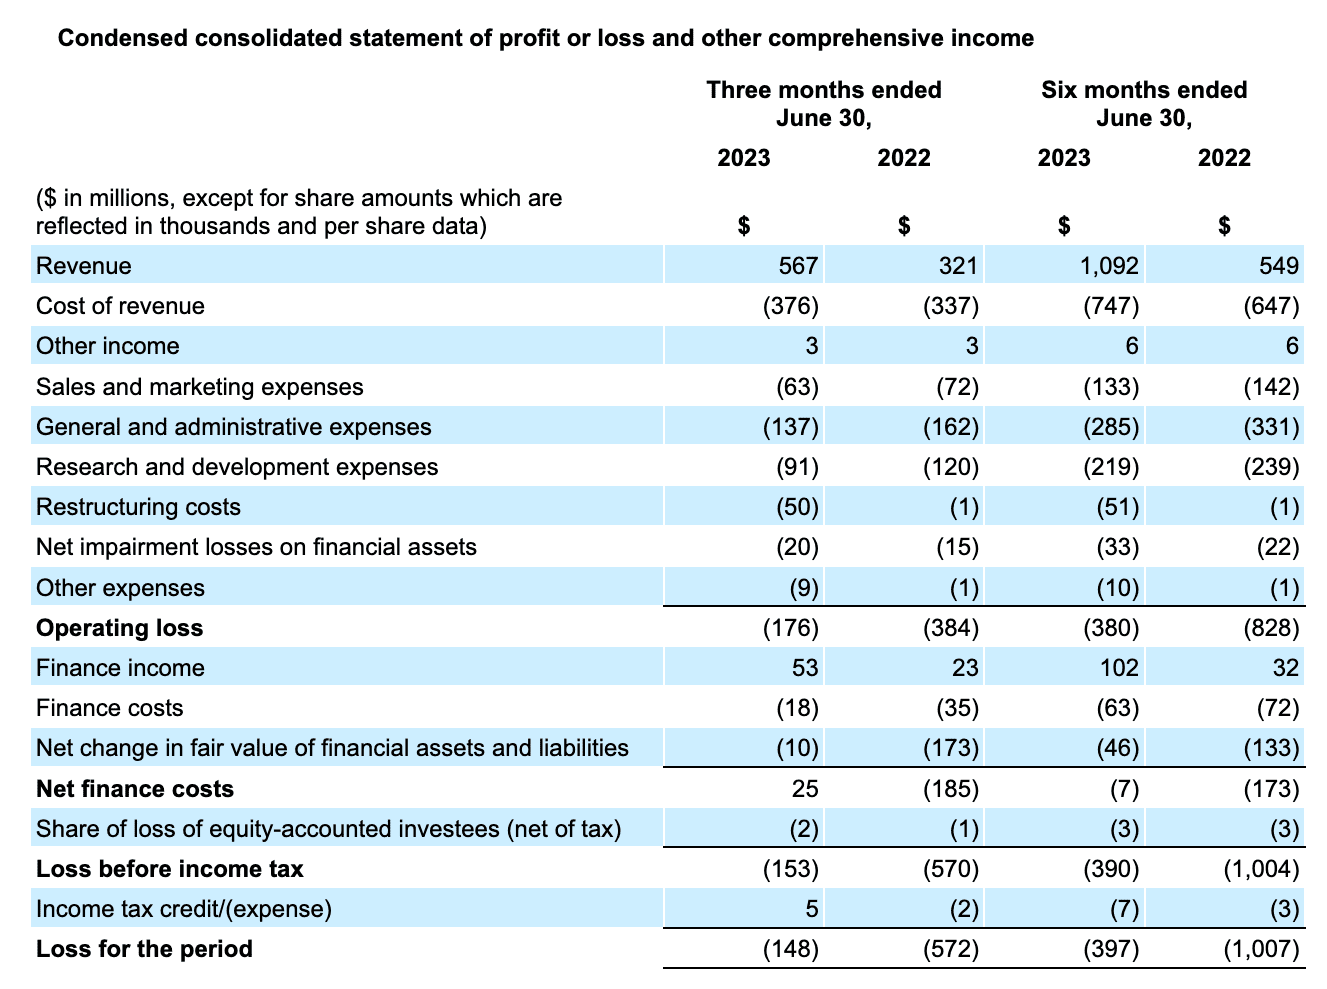
- Q2 2023 Revenue grew 77% year-over-year to $567 million[1]
- Q2 2023 Loss for the period improved by 74% year-over-year to $148 million
- Q2 2023 Adjusted EBITDA improved by 92% year-over-year to $(20) million
- Group Adjusted EBITDA breakeven guidance brought forward to Q3 2023 from Q4 2023
SINGAPORE, August 23, 2023 – Grab Holdings Limited (NASDAQ: GRAB) today announced unaudited financial results for the second quarter ended June 30, 2023.
“We had a strong set of results for the second quarter. Deliveries GMV grew year-over-year (“YoY”) to hit record-highs, supported by our continued push on key affordability initiatives and an expanding GrabUnlimited subscriber base. More people are using Grab today than ever before, as we achieved our highest Monthly Transacting Users to date,” said Anthony Tan, Group Chief Executive Officer and Co-Founder of Grab. “Looking ahead, we will focus on making our platform more valuable to our driver- and merchant-partners, by providing them with tools and services to become more productive and engaged. Our aim is to continue fostering a flourishing ecosystem that enables them to thrive, while delivering sustainable growth for Grab.”
“We continued on our path to profitability, with Group Revenues growing 77% YoY, while delivering our sixth consecutive quarter of Group Adjusted EBITDA improvement. Against the backdrop of a strong first half along with our focus on driving cost efficiencies and maintaining a strong balance sheet, we are revising our Group Adjusted EBITDA guidance range up by $165 million to $195 million, to $(30) million to $(40) million for the full year 2023,” said Peter Oey, Chief Financial Officer of Grab. “We are on track to achieve Group Adjusted EBITDA breakeven in the third quarter of 2023, ahead of our prior target of the fourth quarter of 2023.”
Group Second Quarter 2023 Key Operational and Financial Highlights
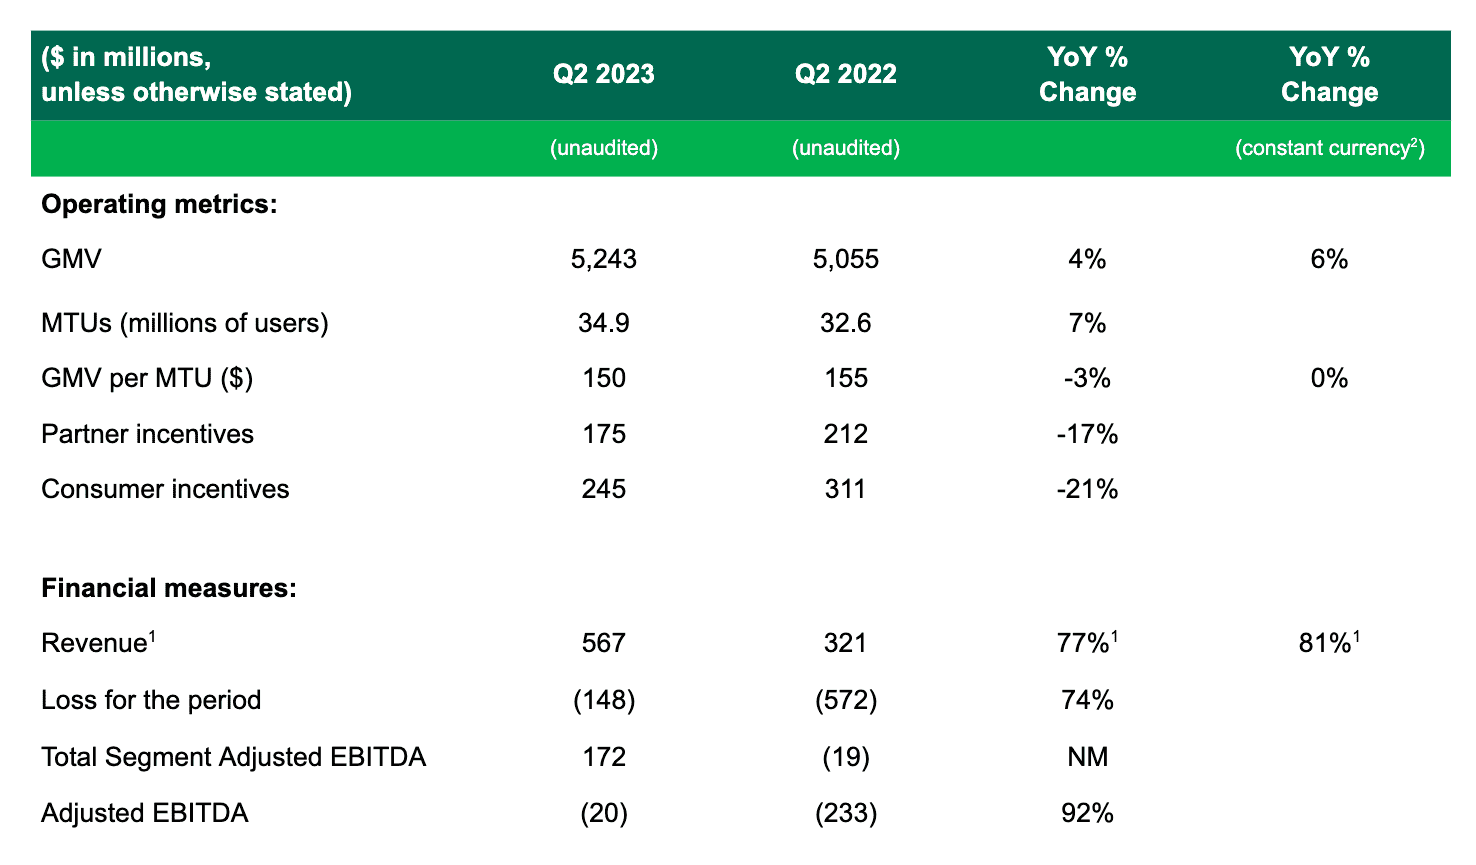
- Revenue grew 77% YoY to $567 million in the second quarter of 2023, or 81% on a constant currency basis[2], attributed to growth across all our segments, continued incentive optimization and a change in business model for certain delivery offerings in one of our markets[1].
- Total GMV grew 4% YoY, or 6% YoY on a constant currency basis, attributed to the growth in Mobility and Deliveries GMV, and Group MTUs growing 7% YoY. Notably, our second quarter 2023 Group MTUs and Deliveries GMV were at all-time highs.
- Total incentives were 8.0% of GMV in the second quarter, compared to 10.4% in the same period in 2022, demonstrating our continued focus on improving the health and efficiency of our marketplace.
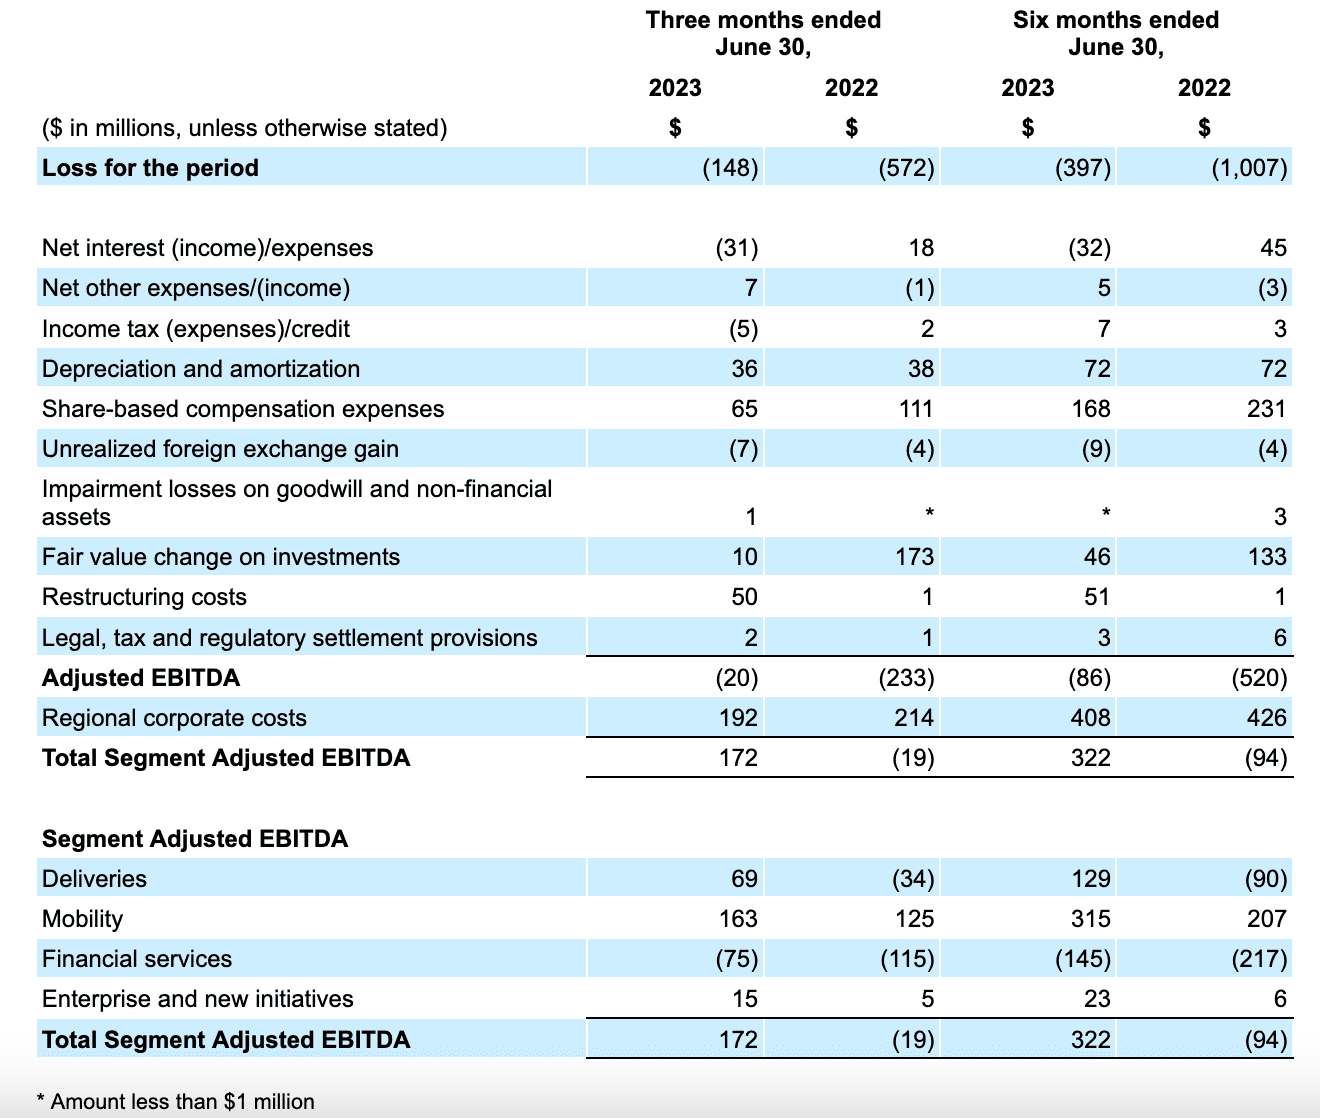
- Loss for the quarter was $148 million, a 74% improvement YoY, primarily due to the improvement in Group Adjusted EBITDA and a reduction in fair value losses on investments, net interest expenses, and share-based compensation expenses. Our loss for the quarter included $65 million in non-cash share-based compensation expenses and a $50 million restructuring charge that largely consisted of costs from the restructuring exercise we conducted in June 2023.
- Group Adjusted EBITDA was negative $20 million for the quarter, an improvement of 92% compared to negative $233 million for the same period in 2022 as we continued to grow GMV and revenue while improving profitability on a Segment Adjusted EBITDA basis and lowering regional corporate costs. Notably, we recorded sequential improvements in Group Adjusted EBITDA on a quarter-over-quarter (“QoQ”) basis for six consecutive quarters.
- Group Adjusted EBITDA margin was (0.4)% for the quarter, an improvement from (4.6)% in the second quarter of 2022 and (1.3)% in the first quarter of 2023.
- Regional corporate costs[3] for the quarter were $192 million, compared to $214 million in the same period in 2022 and $216 million in the prior quarter, as we drove greater cost efficiencies across the organization. Variable expenses declined 31% YoY and 18% QoQ from increased operational efficiencies, specifically driven by lower cloud and direct marketing costs. Staff costs declined 6% YoY and 13% QoQ, attributable to lowered headcount levels across various functions including technology & development, marketing, and general & administrative functions. Additionally, in the second quarter, there were certain fixed cost reversals recognized from the restructuring exercise conducted in June.
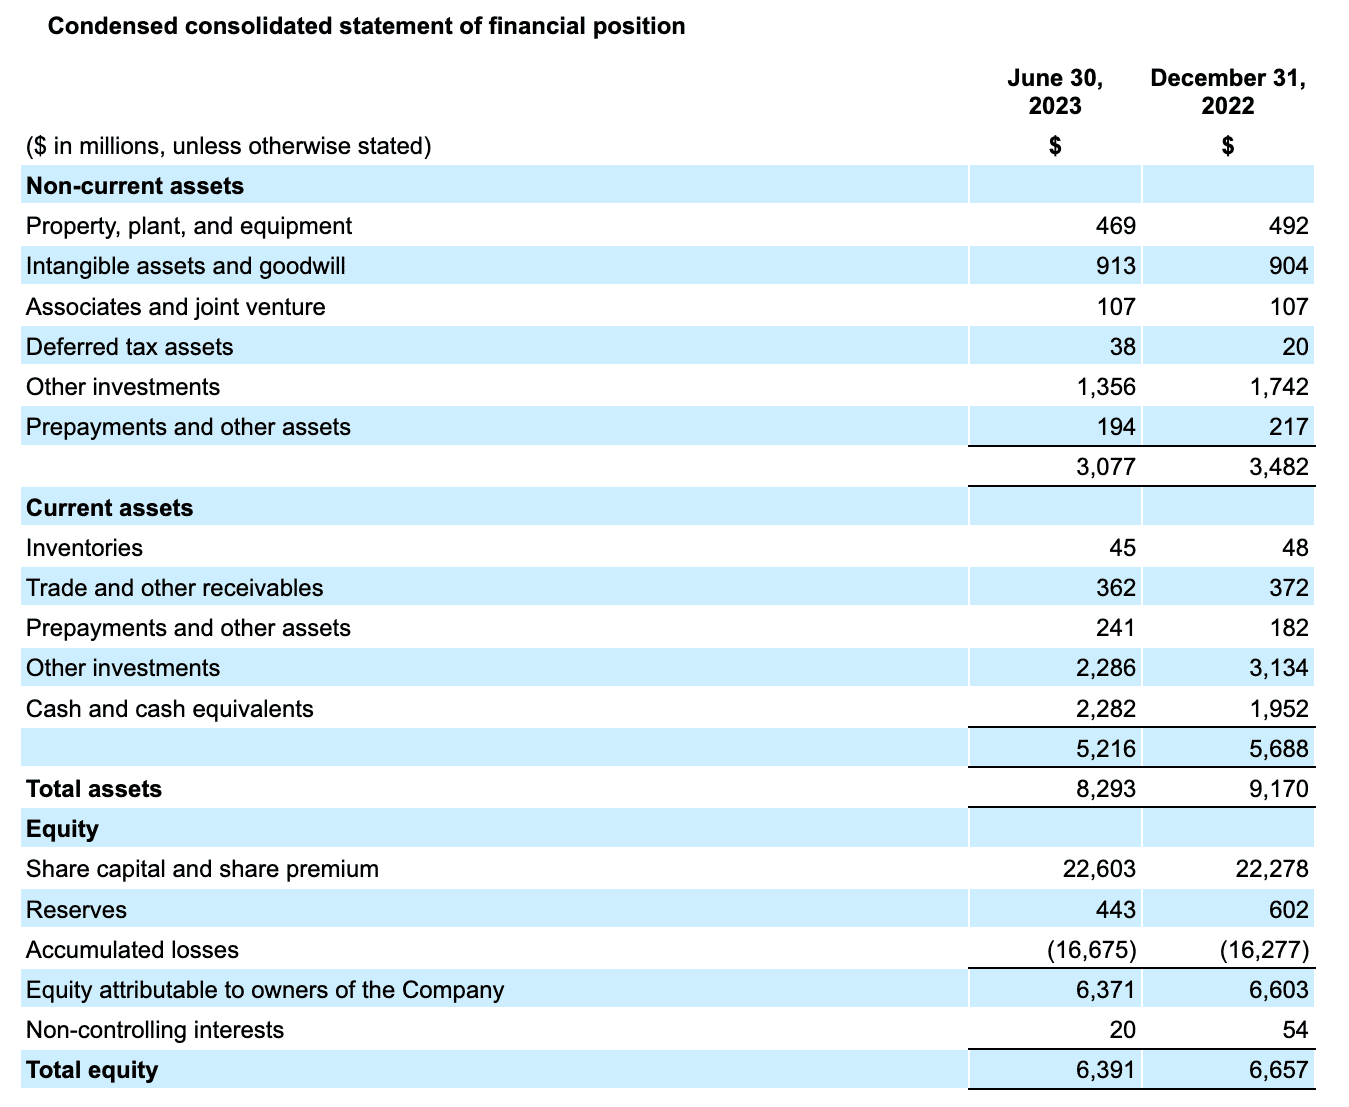
- Cash liquidity[4] totaled $5.6 billion at the end of the second quarter, compared to $5.8 billion at the end of the prior quarter. Our net cash liquidity[5] was $4.9 billion at the end of the second quarter, compared to $5.0 billion at the end of the prior quarter.
Business Outlook
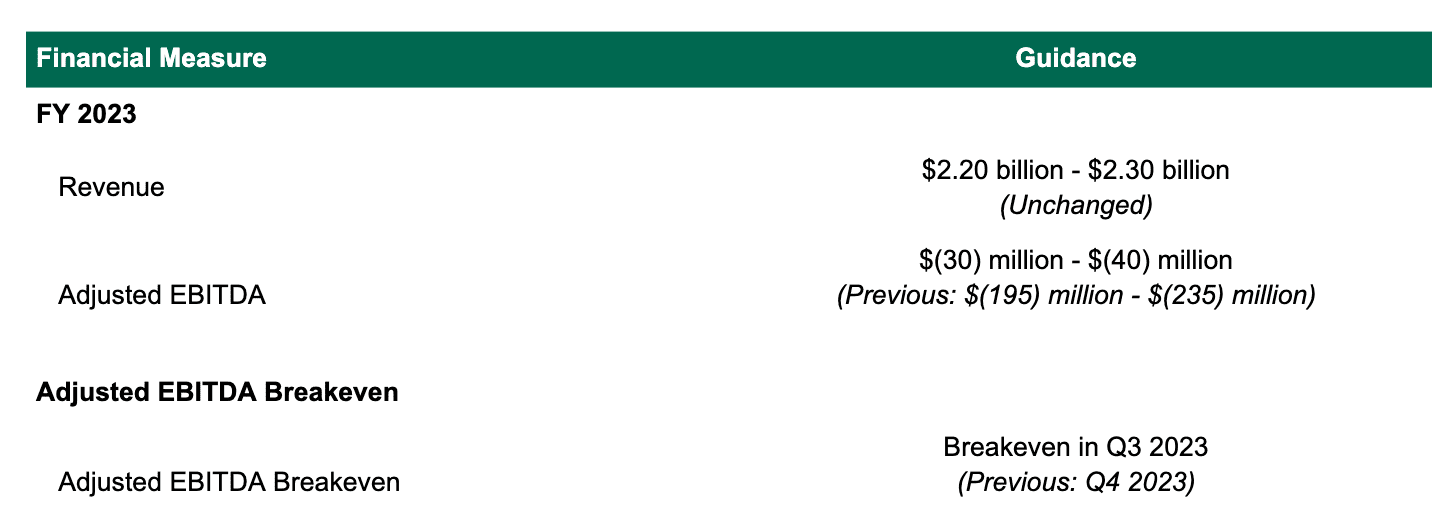
The guidance represents our expectations as of the date of this press release, and may be subject to change.
Segment Financial and Operational Highlights
Deliveries
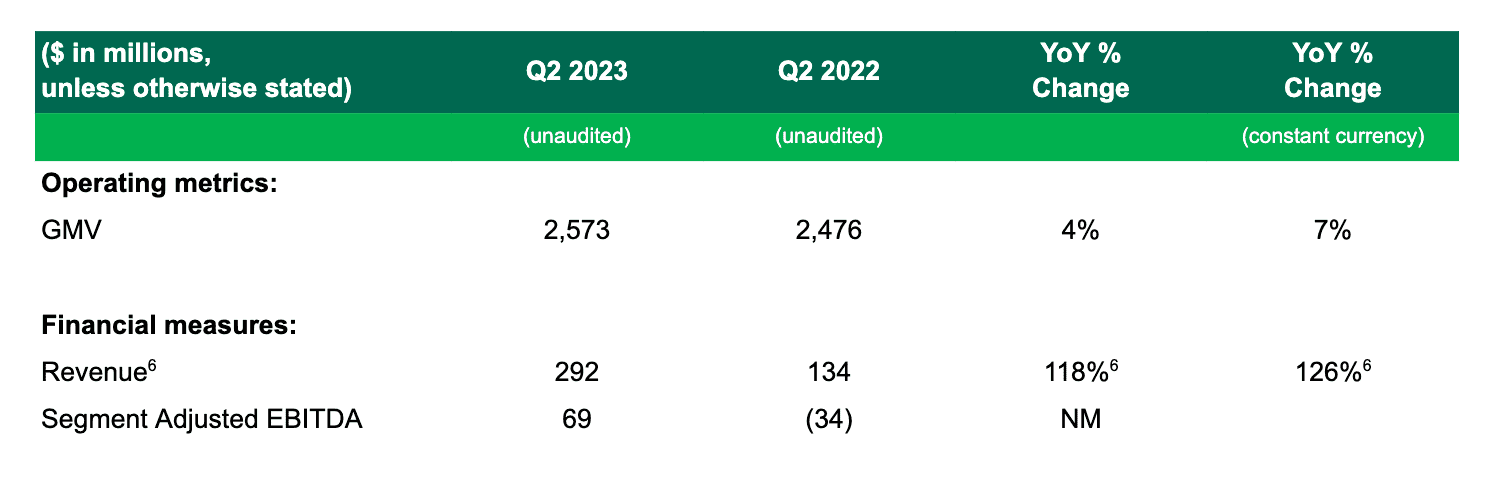
- Deliveries revenue grew 118% YoY, or 126% YoY on a constant currency basis, to $292 million in the second quarter from $134 million in the same period in 2022. The strong growth was primarily attributed to a reduction in incentives, GMV growth, and a change in business model of certain Deliveries offerings in one of our markets[6].
- Deliveries GMV grew 4% YoY, or 7% YoY on a constant currency basis, in the second quarter. On a QoQ basis, Deliveries GMV grew 10%. Growth was underpinned by robust demand for Deliveries, amid our continued focus to improve the affordability of our services and drive user engagement.
- Deliveries segment adjusted EBITDA as a percentage of GMV expanded to an all time high of 2.7% in the second quarter of 2023 from 2.6% in the first quarter of 2023 and negative 1.4% in the second quarter of 2022, amid robust GMV growth, further optimization of incentives spend and increased operational efficiencies.
- Adoption of GrabUnlimited, our subscription program, continues to remain strong, with total GrabUnlimited subscribers increasing 43% YoY and 25% QoQ. Users subscribed to GrabUnlimited had average retention rates[7] that were approximately 2x higher than non-subscribers over the first half of 2023.
- In the second quarter 2023, GrabUnlimited users accounted for almost a third of Deliveries GMV and on average, spent 3.8x more on Food Deliveries services relative to non-subscribers.
Mobility
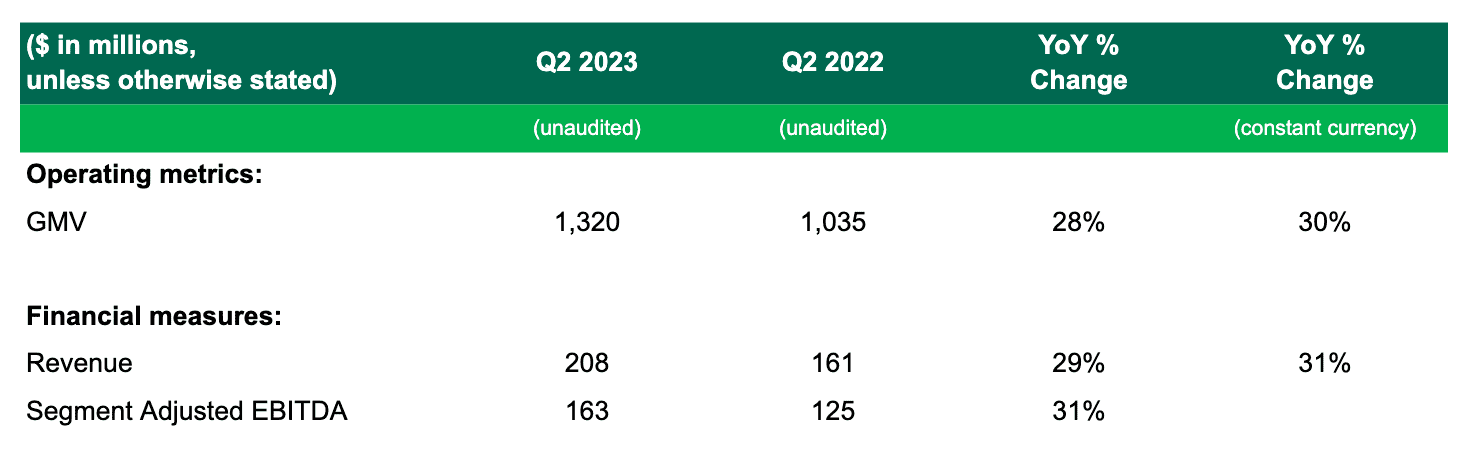
- Mobility revenues continued to grow strongly, rising 29% YoY, or 31% YoY on a constant currency basis, in the second quarter 2023. The increase was mainly attributed to our efforts to improve supply across the region, which enabled us to capture the recovery in tourism ride-hailing demand, and the growth in domestic demand.
- Mobility GMV increased 28% YoY, or 30% YoY on a constant currency basis, supported by the YoY growth in Mobility MTUs and transactions.
- Mobility segment adjusted EBITDA as a percentage of GMV was 12.4% in the second quarter of 2023, increasing from 12.1% in the same period last year, and in line with our steady-state target of 12%.
- During the quarter, we remained focused on increasing active driver supply while optimizing our existing driver supply to meet the strong demand growth. In the second quarter of 2023, monthly active driver supply increased by 10% YoY and 3% QoQ, while earnings per transit hour of our driver-partners increased 9% YoY and 4% QoQ. Our efforts to improve supply have resulted in surged Mobility rides[8] as a proportion of total rides reducing by 460 basis points YoY.
- In the second quarter, Grab rolled out car-pooling mobility services in Malaysia and Indonesia amid our efforts to improve affordability of our services for users. Today, we have car-pooling mobility services in Singapore, Philippines, Malaysia and Indonesia. We have also launched the enhanced MOVE IT app in the Philippines, our two-wheel ride-hailing service in the country, which now integrates Grab’s technology to enhance its operational efficiency and improve its safety and service quality standards.
Financial Services
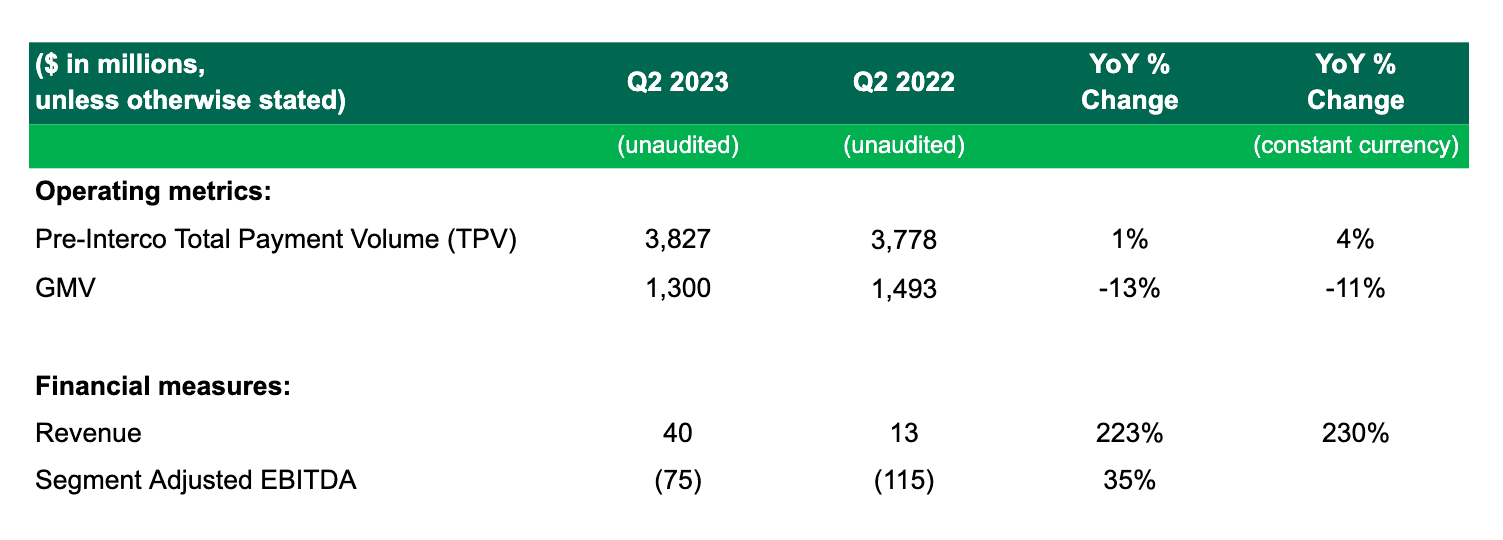
- Revenue for Financial Services grew 223% YoY, or 230% YoY on a constant currency basis, to $40 million in the second quarter of 2023. The YoY growth was driven primarily by improved monetization of our payments business and higher contributions from other services such as lending.
- GMV for Financial Services declined 13% YoY or 11% on a constant currency basis, consistent with our efforts to focus on ecosystem transactions.
- Segment adjusted EBITDA for the quarter improved by 35% YoY to negative $75 million, as an increase in Digibank-related costs was more than offset by lowered spend in GrabFin.
- Loans disbursed to our ecosystem partners continued to gain traction, with total loan disbursements growing by 47% YoY and 19% QoQ.
- In July, our digital bank in Singapore (GXS Bank) announced that it opened up the GXS Savings Account to all eligible individuals in Singapore, and increased the maximum deposit amount for individual savings accounts to S$75,000 from S$5,000 prior. Ecosystem linkages are healthy, with one in two GXS users linking their GXS accounts to Grab.
Enterprise and New Initiatives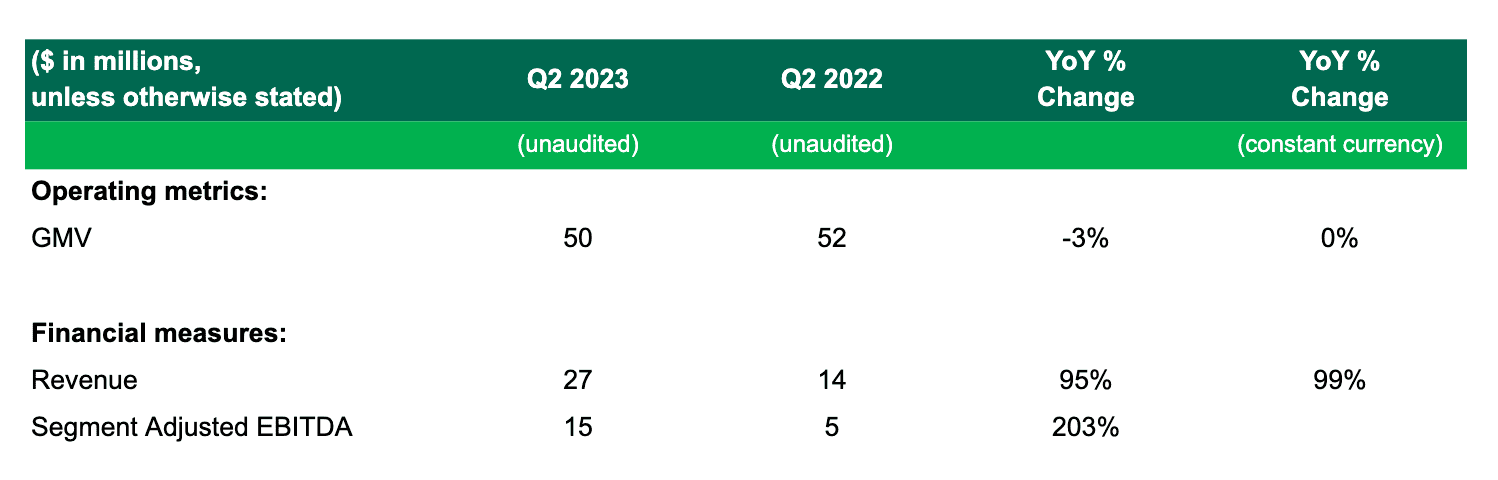
- Revenue from Enterprise and New Initiatives rose 95% YoY, or 99% YoY on a constant currency basis for the second quarter of 2023, primarily attributable to growing contributions from Advertising. Advertising revenues in the second quarter was approximately $100 million on an annualized basis, as we focused on improving the monetization of our Advertising offering and deepening Advertising penetration among our merchant-partners.
- GMV for the second quarter declined 3% YoY and remained flat on a constant currency basis as we continued to drive profitable transactions.
- Segment adjusted EBITDA grew 203% YoY in the quarter compared to the same period in 2022, while Enterprise Segment adjusted EBITDA margins expanded to 30.3% as we improved the monetization of our Advertising offering.
About Grab
Grab is a leading superapp in Southeast Asia, operating across the deliveries, mobility and digital financial services sectors. According to research done by Euromonitor for Indonesia, Malaysia, the Philippines, Singapore, Thailand and Vietnam, Grab remained the category leader in 2022 by GMV in online food deliveries and ride-hailing in Southeast Asia. Serving over 500 cities in eight Southeast Asian countries, Grab enables millions of people to order food or groceries, send packages, hail a ride or taxi, pay for online purchases or access services such as lending and insurance, all through a single app. Grab was founded in 2012 with the mission to drive Southeast Asia forward by creating economic empowerment for everyone, and strives to serve a triple bottom line: to simultaneously deliver financial performance for its shareholders and have a positive social and environmental impact in Southeast Asia.
Forward-Looking Statements
This document and the announced investor webcast contain “forward-looking statements” within the meaning of the “safe harbor” provisions of the U.S. Private Securities Litigation Reform Act of 1995. All statements other than statements of historical fact contained in this document and the webcast, including but not limited to, statements about Grab’s goals, targets, projections, outlooks, beliefs, expectations, strategy, plans, objectives of management for future operations of Grab, and growth opportunities, are forward-looking statements. Some of these forward-looking statements can be identified by the use of forward-looking words, including “anticipate,” “expect,” “suggest,” “plan,” “believe,” “intend,” “estimate,” “target,” “project,” “should,” “could,” “would,” “may,” “will,” “forecast” or other similar expressions. Forward-looking statements are based upon estimates and forecasts and reflect the views, assumptions, expectations, and opinions of Grab, which involve inherent risks and uncertainties, and therefore should not be relied upon as being necessarily indicative of future results. A number of factors, including macro-economic, industry, business, regulatory and other risks, could cause actual results to differ materially from those contained in any forward-looking statement, including but not limited to: Grab’s ability to grow at the desired rate or scale and its ability to manage its growth; its ability to further develop its business, including new products and services; its ability to attract and retain partners and consumers; its ability to compete effectively in the intensely competitive and constantly changing market; its ability to continue to raise sufficient capital; its ability to reduce net losses and the use of partner and consumer incentives, and to achieve profitability; potential impact of the complex legal and regulatory environment on its business; its ability to protect and maintain its brand and reputation; general economic conditions, in particular as a result of COVID-19, currency exchange fluctuations and inflation; expected growth of markets in which Grab operates or may operate; and its ability to defend any legal or governmental proceedings instituted against it. In addition to the foregoing factors, you should also carefully consider the other risks and uncertainties described under “Item 3. Key Information – D. Risk Factors” and in other sections of Grab’s annual report on Form 20-F for the year ended December 31, 2022, as well as in other documents filed by Grab from time to time with the U.S. Securities and Exchange Commission (the “SEC”).
Forward-looking statements speak only as of the date they are made. Grab does not undertake any obligation to update any forward-looking statement, whether as a result of new information, future developments, or otherwise, except as required under applicable law.
Unaudited Financial Information
Grab’s unaudited selected financial data for the three months and six months ended June 30, 2023 and 2022 included in this document and the investor webcast is based on financial data derived from the Grab’s management accounts that have not been reviewed or audited.
Non-IFRS Financial Measures
This document and the investor webcast include references to non-IFRS financial measures, which include: Adjusted EBITDA, Segment Adjusted EBITDA, Total Segment Adjusted EBITDA and Adjusted EBITDA margin. Grab uses these non-IFRS financial measures for financial and operational decision-making and as a means to evaluate period-to-period comparisons, and Grab’s management believes that these non-IFRS financial measures provide meaningful supplemental information regarding its performance by excluding certain items that may not be indicative of its recurring core business operating results. For example, Grab’s management uses: Total Segment Adjusted EBITDA as a useful indicator of the economics of Grab’s business segments, as it does not include regional corporate costs. However, there are a number of limitations related to the use of non-IFRS financial measures, and as such, the presentation of these non-IFRS financial measures should not be considered in isolation from, or as an alternative to, financial measures determined in accordance with IFRS. In addition, these non-IFRS financial measures may differ from non-IFRS financial measures with comparable names used by other companies. See below for additional explanations about the non-IFRS financial measures, including their definitions and a reconciliation of these measures to the most directly comparable IFRS financial measures. With regard to forward-looking non-IFRS guidance and targets provided in this document and the investor webcast, Grab is unable to provide a reconciliation of these forward-looking non-IFRS measures to the most directly comparable IFRS measures without unreasonable efforts because the information needed to reconcile these measures is dependent on future events, many of which Grab is unable to control or predict.
Explanation of non-IFRS financial measures:
- Adjusted EBITDA is a non-IFRS financial measure calculated as net loss adjusted to exclude: (i) interest income (expenses), (ii) other income (expenses), (iii) income tax expenses (credit), (iv) depreciation and amortization, (v) share-based compensation expenses, (vi) costs related to mergers and acquisitions, (vii) unrealized foreign exchange gain (loss), (viii) impairment losses on goodwill and non-financial assets, (ix) fair value changes on investments, (x) restructuring costs, (xi) legal, tax and regulatory settlement provisions and (xii) share listing and associated expenses.
- Segment Adjusted EBITDA is a non-IFRS financial measure, representing the Adjusted EBITDA of each of our four business segments, excluding, in each case, regional corporate costs.
- Total Segment Adjusted EBITDA is a non-IFRS financial measure, representing the sum of Adjusted EBITDA of our four business segments.
- Adjusted EBITDA margin is a non-IFRS financial measure calculated as Adjusted EBITDA divided by Gross Merchandise Value.
This document and the investor webcast also includes “Pre-InterCo” data that does not reflect elimination of intragroup transactions, which means such data includes earnings and other amounts from transactions between entities within the Grab group that are eliminated upon consolidation. Such data differs materially from the corresponding figures post-elimination of intra-group transactions.
We compare the percent change in our current period results from the corresponding prior period using constant currency. We present constant currency growth rate information to provide a framework for assessing how our underlying GMV and revenue performed excluding the effect of foreign currency rate fluctuations. We calculate constant currency by translating our current period financial results using the corresponding prior period’s monthly exchange rates for our transacted currencies other than the U.S. dollar.
Operating Metrics
Gross Merchandise Value (GMV) is an operating metric representing the sum of the total dollar value of transactions from Grab’s products and services, including any applicable taxes, tips, tolls, surcharges and fees, over the period of measurement. GMV includes sales made through offline stores. GMV is a metric by which Grab understands, evaluates and manages its business, and Grab’s management believes is necessary for investors to understand and evaluate its business. GMV provides useful information to investors as it represents the amount of a consumer’s spend that is being directed through Grab’s platform. This metric enables Grab and investors to understand, evaluate and compare the total amount of customer spending that is being directed through its platform over a period of time. Grab presents GMV as a metric to understand and compare, and to enable investors to understand and compare, Grab’s aggregate operating results, which captures significant trends in its business over time.
Total Payments Volume (TPV) means total payments volume received from consumers, which is an operating metric defined as the value of payments, net of payment reversals, successfully completed through our platform.
Monthly Transacting User (MTUs) is defined as the monthly number of unique users who transact via Grab’s apps (including OVO), where transact means to have successfully paid for any of Grab’s products or services. MTUs over a quarterly or annual period are calculated based on the average of the MTUs for each month in the relevant period. Starting in 2023, MTUs additionally include the monthly number of unique users who transact with Grab offline while recording their loyalty points on Grab’s apps. MTUs is a metric by which Grab understands, evaluates and manages its business, and Grab’s management believes is necessary for investors to understand and evaluate its business.
Partner incentives is an operating metric representing the dollar value of incentives granted to driver- and merchant-partners, the effect of which is to reduce revenue. The incentives granted to driver- and merchant-partners include base incentives and excess incentives, with base incentives being the amount of incentives paid to driver- and merchant-partners up to the amount of commissions and fees earned by us from those driver- and merchant-partners, and excess incentives being the amount of payments made to driver- and merchant-partners that exceed the amount of commissions and fees earned by us from those driver- and merchant-partners. For certain delivery offerings where Grab is contractually responsible for delivery services provided to end-users, incentives granted to driver-partners are recognized in cost of revenue.
Consumer incentives is an operating metric representing the dollar value of discounts and promotions offered to consumers, the effect of which is to reduce revenue. Partner incentives and consumer incentives are metrics by which we understand, evaluate and manage our business, and we believe are necessary for investors to understand and evaluate our business. We believe these metrics capture significant trends in our business over time.
Industry and Market Data
This document also contains information, estimates and other statistical data derived from third party sources (including Euromonitor), including research, surveys or studies, some of which are preliminary drafts, conducted by third parties, information provided by customers and/or industry or general publications. Such information involves a number of assumptions and limitations and due to the nature of the techniques and methodologies used in market research, and as such neither Grab nor the third-party sources (including Euromonitor) can guarantee the accuracy of such information. You are cautioned not to give undue weight on such estimates. Grab has not independently verified such third-party information, and makes no representation as to the accuracy of such third-party information.
Unaudited Summary of Financial Results
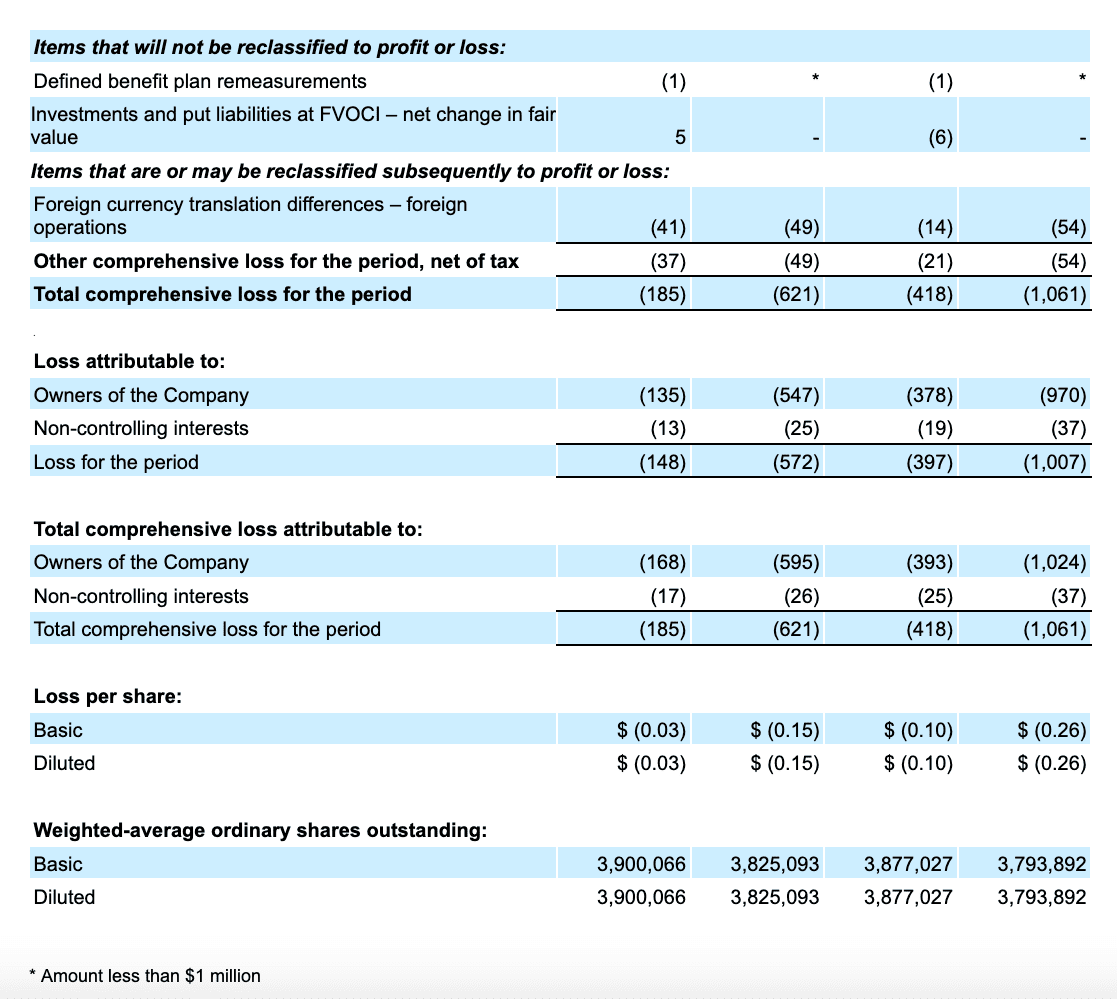
As we incurred a net loss for the period ended June 30, 2023, basic loss per share was the same as diluted loss per share.
The number of outstanding Class A and Class B ordinary shares was 3,791 million and 113 million for the period ended June 30, 2023. 362 million potentially dilutive outstanding securities were excluded from the computation of diluted loss per ordinary share because their effects would have been antidilutive for the period ended June 30, 2023, or issuance of such shares is contingent upon the satisfaction of certain conditions which were not satisfied by the end of the period.
[1] Deliveries Revenues benefited in Q2 2023 due to a business model change implemented in Q4 2022 for certain delivery offerings in one of our markets from being an agent arranging for delivery services provided by our driver-partners to end-users, to being a principal whereby Grab is the delivery service provider contractually responsible for the delivery services provided to end-users. Assuming the change in business model had occurred in 2022, Q2 2023 Group revenue growth would have been 43% YoY.
[2] We calculate constant currency by translating our current period financial results using the corresponding prior period’s monthly exchange rates for our transacted currencies other than the U.S. dollar.
[3] Regional corporate costs are costs that have not been attributed to any of the business segments, including certain costs of revenue, research and development expenses, general and administrative expenses and marketing expenses. These regional costs of revenue include cloud computing costs. These regional research and development expenses also include mapping and payment technologies and support and development of the internal technology infrastructure. These general and administrative expenses also include certain shared costs such as finance, accounting, tax, human resources, technology and legal costs. Regional corporate costs exclude share-based compensation expenses and capitalized software costs.
[4] Cash liquidity includes cash on hand, time deposits and marketable securities.
[5] Net cash liquidity includes cash liquidity less loans and borrowings.
[6] Deliveries Revenues benefited in Q2 2023 due to a business model change implemented in Q4 2022 for certain delivery offerings in one of our markets from being an agent arranging for delivery services provided by our driver-partners to end-users, to being a principal whereby Grab is the delivery service provider contractually responsible for the delivery services provided to end-users. Assuming the change in business model had occurred in 2022, Q2 2023 Deliveries revenue growth would have been 39% YoY.
[7] Average 6-month retention rates of GrabUnlimited subscribers in Indonesia, Malaysia, Philippines, Singapore and Thailand over the first half of 2023.
[8] Surged Mobility rides are defined as completed rides where demand exceeds supply in a specified region and/or where pricing regulations adherence is required.