Grab Reports Record Second Quarter 2026 Results, Raises Full-Year Guidance and Announces $750 Million Share Repurchase Program

SINGAPORE, August 4, 2026 – Grab Holdings Limited (NASDAQ: GRAB) today announced unaudited financial results for the second quarter ended June 30, 2026.
“We delivered another strong quarter. We executed against our product and AI-led strategy with On-Demand GMV growth accelerating to 22% year-over-year (“YoY”) on a constant currency basis2, and we reached a record 54 million Monthly Transacting Users,” said Anthony Tan, Group Chief Executive Officer and Co-Founder of Grab. “Our Grab intelligence layer is now embedded across every layer of our platform, lifting driver and merchant-partner earnings, while improving our operating efficiency. We expect this intelligence layer to further strengthen as it scales, translating directly into deeper user engagement, and durable, profitable growth for Grab.”
“Adjusted EBITDA margin expanded to 16.9% of Group revenue from 13.3% a year ago, marking our eighteenth straight quarter of Adjusted EBITDA growth and proving that our business model scales,” said Peter Oey, Chief Financial Officer of Grab. “We are raising our full-year 2026 guidance to $4.10 billion to $4.15 billion in Group revenue and $720 million to $740 million in Adjusted EBITDA, reflecting the strength of our underlying business alongside the consolidation of Superbank and the acquisition of Stash. We remain anchored to a disciplined capital allocation framework, and the Board has authorized an additional $750 million in share repurchases, bringing our cumulative authorization to $1.75 billion since 2024.”
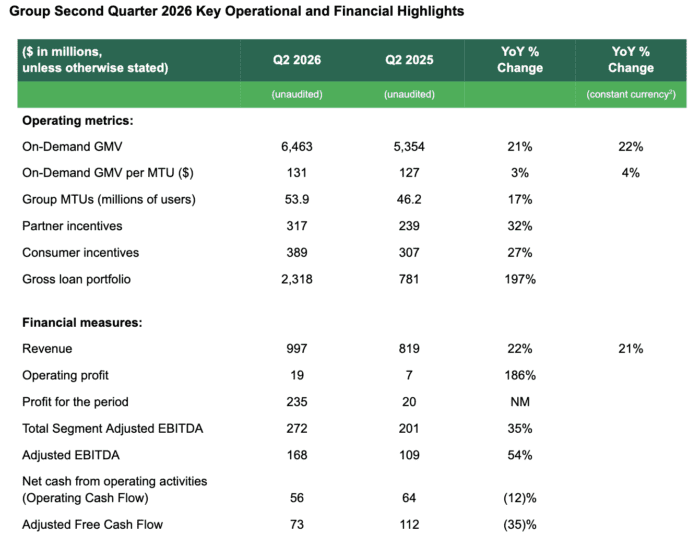
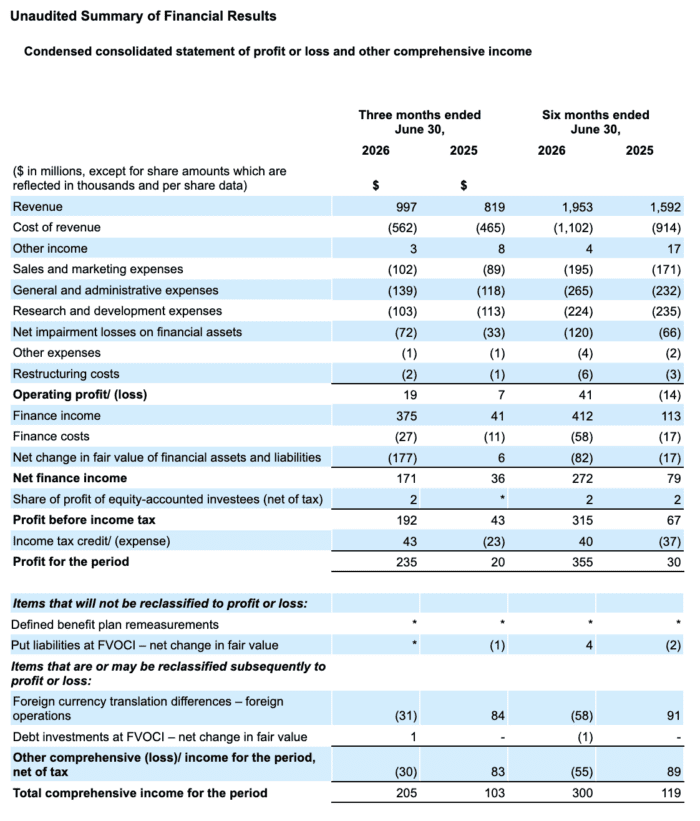
- Revenue grew 22% YoY, or 21% YoY on a constant currency basis, to $997 million in the second quarter of 2026, driven by continued growth across our On-Demand and Financial Services segments.
- On-Demand GMV grew 21% YoY, or 22% YoY on a constant currency basis, to $6.5 billion, as On-Demand MTU and GMV per MTU grew by 17% and 3%, respectively.
- Total incentives were $706 million during the quarter. On-Demand incentives as a proportion of On-Demand GMV increased 72 basis points YoY to 10.9%, driven by initiatives to support earnings of our driver-partners in light of increased fuel costs across the region and targeted user investments to accelerate the adoption of our affordable product tiers and deepen user frequency.
- Operating profit in the second quarter improved $12 million YoY to reach $19 million, primarily driven by higher revenue growth across all segments. This was partially offset by increases in cost of revenue mainly from the expansion of Jaya and Everrise stores, and higher net impairment losses on financial assets mainly driven by Digibank expected credit losses.
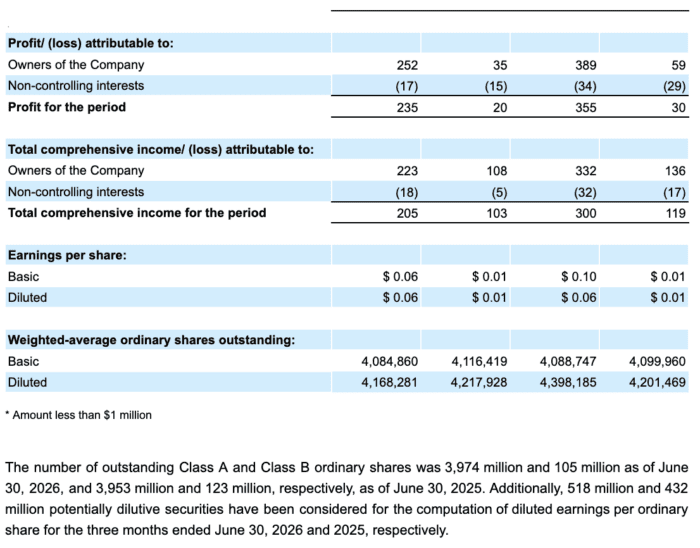
- Profit for the period was $235 million, growing from $20 million in the prior year period. On a YoY basis, the increase was primarily driven by a $334 million increase in finance income, mainly attributable to a $307 million gain recognized upon consolidating Superbank since June 2026 and a $66 million favourable movement in income tax expense attributed to the recognition of deferred tax assets. These were partially offset by a $183 million increase in fair value loss on our financial assets and liabilities. The Superbank remeasurement gain was one-time in nature. We expect our profit for the period in the second half to continue to reflect a degree of variability tied to fair value measurements and other non-operating items.
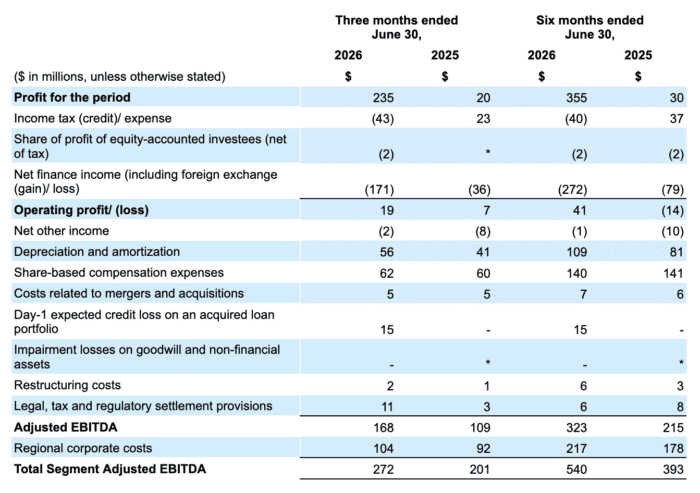
- Adjusted EBITDA was $168 million for the quarter, up 54% YoY from $109 million in the prior year period, as we grew revenue and improved profitability across all our segments. Adjusted EBITDA margin improved to 16.9% of revenue from 13.3% in the second quarter of 2025.
- Regional corporate costs3 for the quarter increased by $12 million YoY to $104 million driven primarily by increases in cloud and software costs. On a QoQ basis, regional corporate costs narrowed by $10 million due to lower staff costs and professional fees.
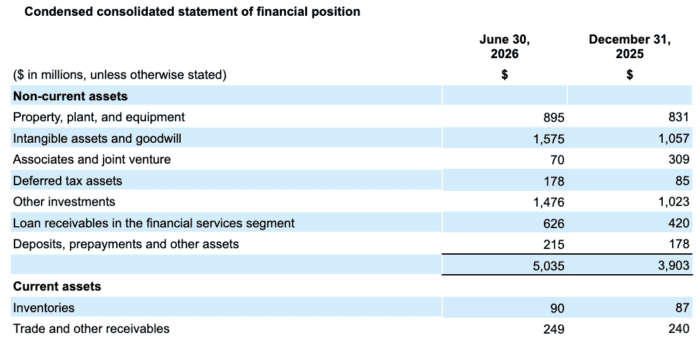
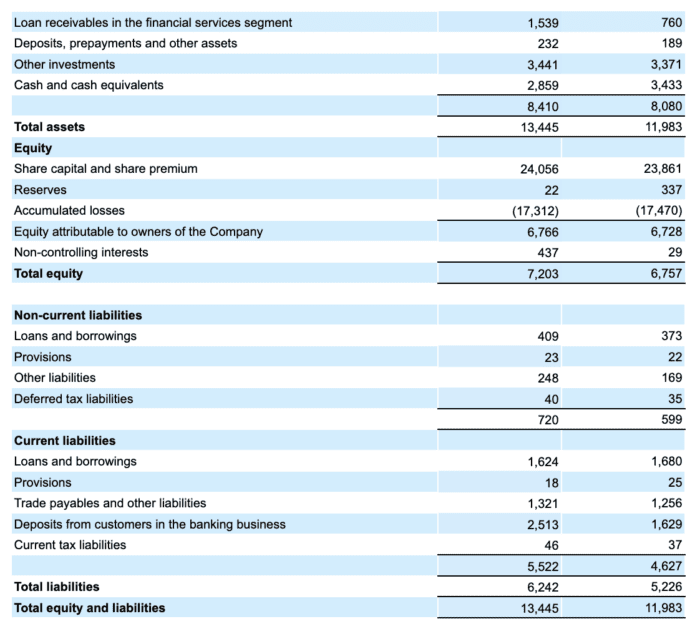
- Gross cash liquidity4 totaled $7.4 billion as of June 30, 2026 compared to $6.9 billion as of the end of the prior quarter. Net cash liquidity5 was $5.4 billion as of June 30, 2026 compared to $5.0 billion as of the end of the prior quarter.
- As of July 2026, we fully executed the accelerated share repurchase agreement and contingent forward purchase agreement to repurchase $250 million and $101 million, respectively, worth of Class A ordinary shares, as part of our previously announced $500 million share repurchase programme approved by our Board of Directors in February 2026.
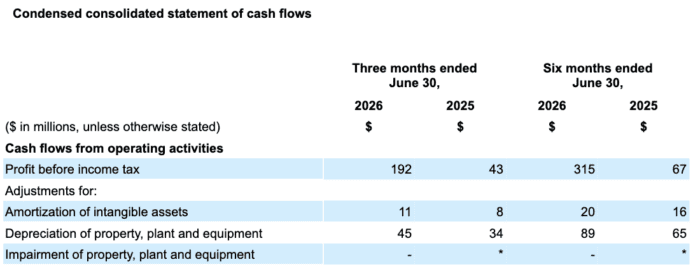
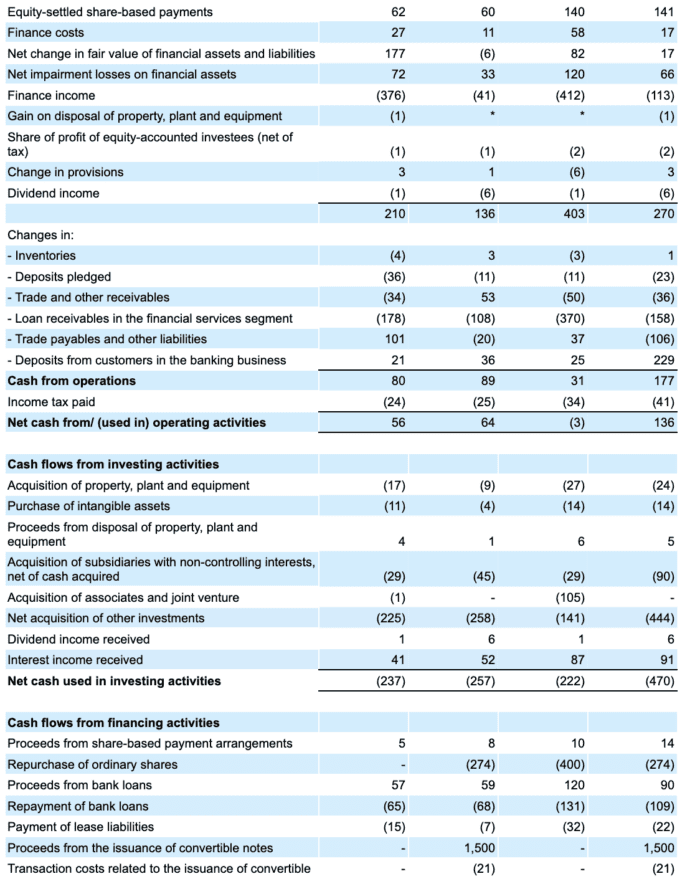
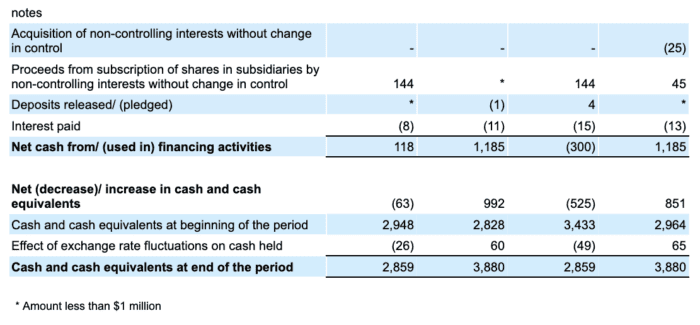
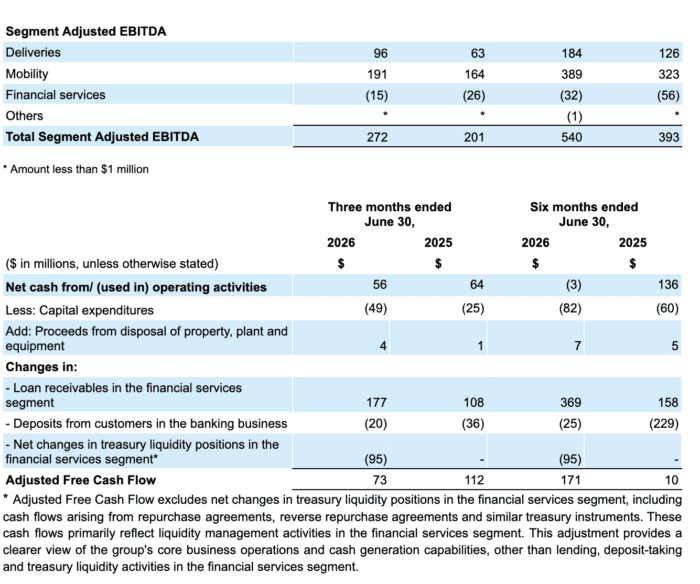
- Operating Cash Flow was $56 million in the second quarter of 2026, a reduction of $8 million YoY due to higher working capital requirements.
- Adjusted Free Cash Flow6 was $73 million for the quarter, a $39 million decline YoY, due to higher capital expenditures and lower net cash from operating activities. On a trailing twelve months basis as of June 30, 2026, Adjusted Free Cash Flow was $450 million.
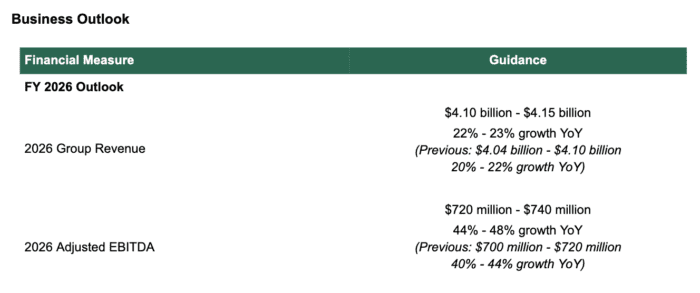
The above guidance and expected YoY growth represents our expectations as of the date of this press release and may be subject to change.
Segment Financial and Operational Highlights
Deliveries
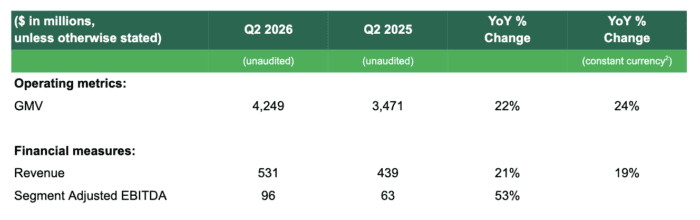
- Deliveries revenue grew 21% YoY, or 19% YoY on a constant currency basis, to $531 million in the second quarter of 2026. Growth was primarily driven by GMV expansion and continued momentum in our Advertising business.
- Deliveries GMV grew 24% YoY on a constant currency basis to $4,249 million in the quarter, driven by increases in the total number of Deliveries transactions, Deliveries MTUs, and GMV per MTU.
- Deliveries Segment Adjusted EBITDA as a percentage of GMV was 2.3% during the quarter, improving by 45 basis points from 1.8% in the prior year period. This improvement was primarily driven by improvements in operating leverage and Advertising contributions.
- Average monthly active Deliveries merchant-partners grew 8% YoY while average earnings of these merchant-partners grew 14% YoY. We also deepened Advertising penetration with total quarterly active advertisers on our self-serve platform growing 21% YoY, and average spend of these advertisers growing 24% YoY.
Mobility
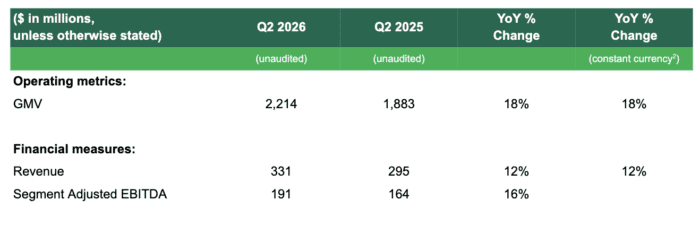
- Mobility revenue grew 12% YoY on an actual and constant currency basis, to $331 million in the second quarter of 2026. Growth was underpinned by increases in Mobility GMV and continued expansion of Mobility MTUs and transactions.
- Mobility GMV grew 18% YoY on an actual and constant currency basis, to reach $2,214 million during the quarter. Mobility transaction growth continued to outpace GMV growth as we enhanced the affordability of our services, with Mobility transactions growing 28% YoY.
- Mobility Segment Adjusted EBITDA as a percentage of Mobility GMV was 8.6% during the quarter, declining 9bps YoY as we recalibrated incentive spend towards driver-partners to strengthen supply.
- During the quarter, we committed over $7 million to support On-Demand driver-partner earnings amid the ongoing fuel crisis. As a result, during the quarter, average monthly active driver-partners grew 19% YoY to reach another all-time high.
Financial Services
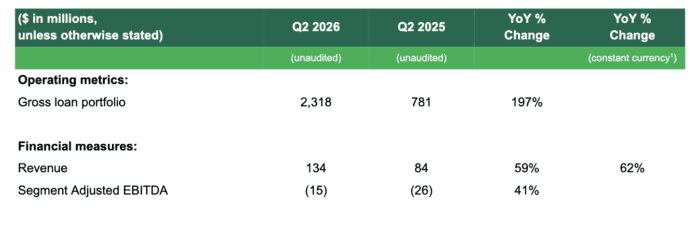
- Financial Services revenue grew 59% YoY, or 62% YoY on a constant currency basis, to $134 million in the second quarter of 2026. Revenue growth was primarily driven by increased lending contributions across GrabFin and our Digibanks, including the consolidation of Superbank in June 2026. Total loans disbursed grew 72% YoY to reach an all-time high of $1.2 billion during the quarter.
- Gross Loan Portfolio scaled 197% YoY to reach $2.3 billion during the quarter, from $781 million in the prior year period. Excluding contributions from Superbank, Gross Loan Portfolio doubled YoY.
- Financial Services Segment Adjusted EBITDA improved by $11 million YoY to negative $15 million in the second quarter of 2026 from negative $26 million in the prior year period, reflecting increased revenue contributions from our lending businesses and new contributions from Superbank.
- Total customer deposits across GXS Bank (Singapore), GXBank (Malaysia), and Superbank (Indonesia) grew to $2.5 billion at the end of the second quarter of 2026.
- In July 2026, we completed the acquisition of 100% of the equity interest in Stash Financial, Inc. (“Stash”). Payment for a 50.1% equity stake was made at closing, with the remaining consideration to be paid at fair market value over a three-year post-closing period. The financial results and operations of Stash will be consolidated into our Financial Services segment beginning in the third quarter of 2026.
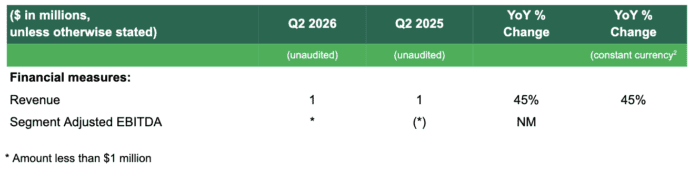
Others
Other Events
Grab’s Board of Directors has authorized a new share repurchase program, under which Grab may repurchase up to $750 million worth of its outstanding Class A ordinary shares. The proposed repurchases may be made from time to time through open market transactions at prevailing market prices, privately negotiated transactions, block trades and/or through other legally permissible means, or any combination thereof, depending on market conditions and the trading price of the Company’s Class A ordinary shares, among other factors, and in accordance with applicable rules and regulations. The Company’s Board of Directors will review the share repurchase program periodically, and may amend the terms and size of the program. The Company intends to fund the repurchases with excess cash after allocating and potentially allocating for investments to drive growth. The share repurchase program does not obligate the Company to acquire any particular amount of Class A ordinary shares.
1 These are non-IFRS measures. For a reconciliation of non-IFRS financial measures to the most directly comparable IFRS measure, see the section titled “Non-IFRS Financial Measures” on Page 10.
2 We calculate constant currency by translating our current period financial results using the corresponding prior period’s monthly exchange rates for our transacted currencies other than the U.S. dollar.
3 Regional corporate costs are costs that are not attributed to any of the business segments, including certain cost of revenue, research and development expenses, general and administrative expenses and marketing expenses. These regional costs of revenue include cloud computing costs. These regional research and development expenses also include mapping and payment technologies and support and development of the internal technology infrastructure. These general and administrative expenses also include certain shared costs such as finance, accounting, tax, human resources, technology and legal costs. Regional corporate costs exclude share-based compensation expenses and capitalized software costs.
4 Gross cash liquidity includes cash on hand, short-term and long-term time deposits, marketable securities and restricted cash.
5 Net cash liquidity includes gross cash liquidity less loans and borrowings.
6 Starting with the second quarter 2026, Adjusted Free Cash Flow excludes net changes in treasury liquidity positions in the Financial Services segment.
Forward-Looking Statements
This document and the announced investor webcast contain “forward-looking statements” within the meaning of the “safe harbor” provisions of the U.S. Private Securities Litigation Reform Act of 1995. All statements other than statements of historical fact contained in this document and the webcast, including but not limited to, statements about Grab’s goals, targets, projections, outlooks, beliefs, expectations, strategy, plans, objectives of management for future operations of Grab, and growth opportunities, are forward-looking statements. Some of these forward-looking statements can be identified by the use of forward-looking words, including “anticipate,” “expect,” “suggest,” “plan,” “believe,” “intend,” “estimate,” “target,” “project,” “should,” “could,” “would,” “may,” “will,” “forecast,” “annualized,” “annualized run-rate,” “on track” or other similar expressions. Forward-looking statements are based upon estimates and forecasts and reflect the views, assumptions, expectations, and opinions of Grab, which involve inherent risks and uncertainties, and therefore should not be relied upon as being necessarily indicative of future results. A number of factors, including macro-economic, industry, business, regulatory and other risks, could cause actual results to differ materially from those contained in any forward-looking statement, including but not limited to: Grab’s ability to grow at the desired rate or scale and its ability to manage its growth; its ability to further develop its business, including new products and services; its ability to attract and retain partners and consumers; its ability to compete effectively in the intensely competitive and constantly changing market; its ability to continue to raise sufficient capital; its ability to reduce net losses and the use of partner and consumer incentives, and to achieve profitability; potential impact of the complex legal and regulatory environment on its business; its ability to protect and maintain its brand and reputation; general economic conditions, in particular as a result of currency exchange fluctuations and inflation; expected growth of markets in which Grab operates or may operate; and its ability to defend any legal or governmental proceedings instituted against it. In addition to the foregoing factors, you should also carefully consider the other risks and uncertainties described under “Item 3. Key Information – D. Risk Factors” and in other sections of Grab’s annual report on Form 20-F for the year ended December 31, 2025, as well as in other documents filed by Grab from time to time with the U.S. Securities and Exchange Commission (the “SEC”).
Forward-looking statements speak only as of the date they are made. Grab does not undertake any obligation to update any forward-looking statement, whether as a result of new information, future developments, or otherwise, except as required under applicable law.
Unaudited Financial Information
Grab’s unaudited selected financial data for the three months ended June 30, 2026 and 2025 included in this document and the investor webcast is based on financial data derived from Grab’s management accounts that have not been reviewed or audited.
Certain amounts and percentages that appear in this document may not sum due to rounding.
Non-IFRS Financial Measures
This document and the investor webcast include references to non-IFRS financial measures, which include: Adjusted EBITDA, Segment Adjusted EBITDA, Segment Adjusted EBITDA margin, Total Segment Adjusted EBITDA, Adjusted EBITDA margin, Adjusted Free Cash Flow, gross cash liquidity and net cash liquidity. Grab uses Adjusted EBITDA, Segment Adjusted EBITDA, Segment Adjusted EBITDA margin, Total Segment Adjusted EBITDA, and Adjusted EBITDA margin for financial and operational decision-making and as a means to evaluate period-to-period comparisons, and Grab’s management believes that these non-IFRS financial measures provide meaningful supplemental information regarding its performance by excluding certain items that may not be indicative of its recurring core business operating results. For example, Grab’s management uses Total Segment Adjusted EBITDA as a useful indicator of the economics of Grab’s business segments, as it does not include regional corporate costs. Adjusted Free Cash Flow excludes the effects of the movement in working capital for our lending and digital banking deposit activities and net changes in treasury liquidity positions in the Financial Services segment. Grab uses Adjusted Free Cash Flow to monitor business performance and assess its cash flow activity other than its lending and digital banking deposit and liquidity management activities, and Grab’s management believes that the additional disclosure serves as a useful indicator for comparison with the cash flow reporting of certain of its peers. Grab uses gross cash liquidity and net cash liquidity to assess our ability to meet short-term obligations and invest in growth opportunities.
However, there are a number of limitations related to the use of non-IFRS financial measures, and as such, the presentation of these non-IFRS financial measures should not be considered in isolation from, or as an alternative to, financial measures determined in accordance with IFRS. In addition, these non-IFRS financial measures may differ from non-IFRS financial measures with comparable names used by other companies. See below for additional explanations about the non-IFRS financial measures, including their definitions and a reconciliation of these measures to the most directly comparable IFRS financial measures. With regard to forward-looking non-IFRS guidance and targets provided in this document and the investor webcast, Grab is unable to provide a reconciliation of these forward-looking non-IFRS measures to the most directly comparable IFRS measures without unreasonable efforts because the information needed to reconcile these measures is dependent on future events, many of which Grab is unable to control or predict.
Explanation of non-IFRS financial measures:
- Adjusted EBITDA is calculated as profit (loss) for the period adjusted to exclude: (i) net finance income (costs), including interest income (expenses), foreign exchange gain (loss) and changes in fair value of financial assets and liabilities, (ii) net other income (expenses), (iii) income tax expenses (credit), (iv) depreciation and amortization, (v) share-based compensation expenses, (vi) costs related to mergers and acquisitions, (vii) impairment losses on goodwill and non-financial assets, (viii) restructuring costs, (ix) legal, tax and regulatory settlement provisions, and (x) other items not indicative of our ongoing operating performance.
- Segment Adjusted EBITDA represents the Adjusted EBITDA of each of our four business segments, excluding, in each case, regional corporate costs.
- Segment Adjusted EBITDA margin is calculated as Segment Adjusted EBITDA divided by Gross Merchandise Value. For Financial Services and Others, Segment Adjusted EBITDA margin is calculated as Segment Adjusted EBITDA divided by Revenue.
- Total Segment Adjusted EBITDA represents the sum of Adjusted EBITDA of our four business segments.
- Adjusted EBITDA margin is calculated as Adjusted EBITDA divided by Revenue.
- Adjusted Free Cash Flow is defined as net cash flows from operating activities less capital expenditures (including assets acquired under lease arrangements), plus proceeds from disposal of property, plant and equipment, and excluding changes in working capital related to loans and advances to customers, and deposits from the digital banking business. Starting with the second quarter 2026, Adjusted Free Cash Flow excludes net changes in treasury liquidity positions in the Financial Services segment.
- Gross cash liquidity includes cash on hand, short-term and long-term time deposits, marketable securities and restricted cash.
- Net cash liquidity includes gross cash liquidity less loans and borrowings.
Constant Currency
We compare the percent change in our current period results from the corresponding prior period using constant currency. We present constant currency growth rate information to provide a framework for assessing how our underlying GMV and revenue performed excluding the effect of foreign currency rate fluctuations. We calculate constant currency by translating our current period financial results using the corresponding prior period’s monthly exchange rates for our transacted currencies other than the U.S. dollar.
Operating Metrics
Gross Merchandise Value (GMV) is an operating metric representing the sum of the total dollar value of transactions from Grab’s products and services, including any applicable taxes, tips, tolls, surcharges and fees, over the period of measurement. GMV includes (i) sales made through offline stores reported under the deliveries segment; and (ii) revenues made from products and services provided to driver-partners, merchant-partners and other customers to support their businesses, such as GrabAds and GrabRentals, reported under the deliveries and/or mobility segment, as applicable. Mobility GMV is an operating metric representing the GMV of our Mobility segment. Deliveries GMV is an operating metric representing the GMV of our Deliveries segment. On-Demand GMV is an operating metric defined as the sum of Mobility GMV and Deliveries GMV. GMV is a metric by which Grab understands, evaluates and manages its business, and Grab’s management believes is necessary for investors to understand and evaluate its business. GMV provides useful information to investors as it represents the amount of customer spend that is being directed through Grab’s platform. This metric enables Grab and investors to understand, evaluate and compare the total amount of customer spending that is being directed through its platform over a period of time. Grab presents GMV as a metric to understand and compare, and to enable investors to understand and compare Grab’s aggregate operating results, which captures significant trends in its business over time.
Monthly Transacting User (MTUs) is defined as the monthly number of unique users who transact via Grab’s apps, where transact means to have successfully paid for or utilized any of Grab’s products or services (including lending and offline Jaya Grocer transactions where users record their Jaya Grocer loyalty points on the Grab app). MTUs over a quarterly or annual period are calculated based on the average of the MTUs for each month in the relevant period. MTUs is a metric by which Grab understands, evaluates and manages its business, and Grab’s management believes is necessary for investors to understand and evaluate its business.
Partner incentives is an operating metric representing the dollar value of incentives granted to driver- and merchant-partners, the effect of which is to reduce revenue. For certain delivery offerings where Grab is contractually responsible for delivery services provided to end-users, incentives granted to driver-partners are recognized in cost of revenue.
Consumer incentives is an operating metric representing the dollar value of discounts and promotions offered to consumers, the effect of which is to reduce revenue. Partner incentives and consumer incentives are metrics by which we understand, evaluate and manage our business, and we believe are necessary for investors to understand and evaluate our business. We believe these metrics capture significant trends in our business over time.
Gross loan portfolio is an operating metric representing the total of current and non-current loan receivables in the financial services segment, gross of expected credit loss allowances as of a given date. Gross loan portfolio reflects the total credit extended to borrowers before deducting loss allowances, providing a measure of lending scale and volume growth that is more directly comparable with Grab’s peers. Our management uses gross loan portfolio to assess origination momentum and portfolio mix, as it is not influenced by period-to-period movements in provisioning levels.
Industry and Market Data
This document may contain information, estimates and other statistical data derived from third party sources, including research, surveys or studies, some of which are preliminary drafts, conducted by third parties, information provided by customers and/or industry or general publications. Such information involves a number of assumptions and limitations due to the nature of the techniques and methodologies used in market research, and as such neither Grab nor the third-party sources can guarantee the accuracy of such information. You are cautioned not to give undue weight to such estimates. Grab has not independently verified such third-party information, and makes no representation as to the accuracy of such third-party information.
Impact of $1.5 Billion Convertible Notes Offering on Reported Financial Results
The conversion feature within the convertible notes is accounted for as a derivative liability under IFRS, with its fair value re-measured each reporting period. While this generates volatility in profit/loss, it does not impact Grab’s underlying cash flows or adjusted EBITDA.