Grab Reports Fourth Quarter and Full Year 2022 Results
Grab Holdings Limited (NASDAQ: GRAB) today announced unaudited financial results for the fourth quarter and full year ended December 31, 2022.
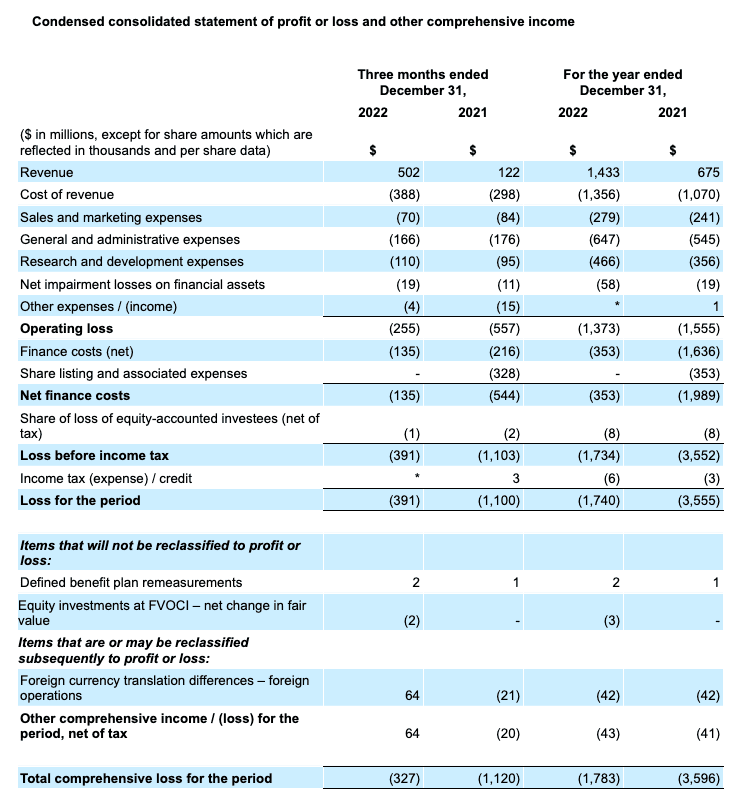
- Q4 2022 Revenue grew 310% year-over-year to $502 million, and 2022 Revenue grew by 112% year-over-year to $1,433 million[1]
- Q4 2022 GMV grew 11% year-over-year to $5.0 billion, and 2022 GMV grew by 24% year-over-year to $19.9 billion
- Q4 2022 Loss for the period improved by 64% year-over-year to $391 million, with 2022 Loss for the year improving by 51% year-over-year to $1,740 million
- Group Adjusted EBITDA breakeven guidance brought forward to the fourth quarter of 2023 from the second half of 2024
SINGAPORE, February 23, 2023 – Grab Holdings Limited (NASDAQ: GRAB) today announced unaudited financial results for the fourth quarter and full year ended December 31, 2022.
“Our 2022 and fourth quarter results demonstrate our commitment to accelerating our path to profitability. In the fourth quarter, we achieved revenue growth of 310% year-over-year (“YoY”)[1], while improving our Group and Deliveries Segment Adjusted EBITDA margins and maintaining regional category leadership across our Mobility and Food Deliveries businesses. We achieved these results by focusing on capturing the rebound in Mobility demand, optimizing our costs, reducing our cost-to-serve and innovating on products and services that drive stickiness and engagement within our ecosystem. As we look ahead, we will remain laser-focused on driving sustainable growth, and improving the efficiency of our ecosystem,” said Anthony Tan, Group Chief Executive Officer and Co-Founder of Grab.
“We are pleased to report a strong set of results, with full year revenues and second half 2022 Adjusted EBITDA coming in well above our guidance ranges. In the fourth quarter, we recorded strong year-over-year growth in Mobility revenue of 78%, and in our Deliveries segment, we focused on driving a more profitable and sustainable business, which resulted in Deliveries Segment Adjusted EBITDA margins improving substantially on a year-over-year and quarter-over-quarter basis. This sets us up for a strong 2023 as we continue to focus on growing in a sustainable manner by driving cost efficiencies across our organization, and driving margin improvements whilst being prudent with our capital. We are accelerating our group breakeven outlook on an Adjusted EBITDA basis to the fourth quarter of 2023, earlier than our prior expectations of the second half of 2024,” said Peter Oey, Chief Financial Officer of Grab.
Group Fourth Quarter 2022 Key Operational and Financial Highlights
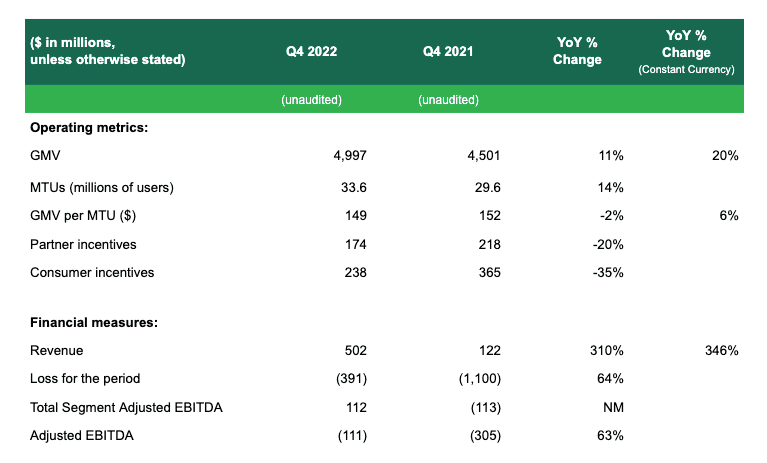
- Revenue grew 310% YoY to $502 million in the fourth quarter of 2022, or 346% on a constant currency basis[2], attributable to growth in our Mobility and Deliveries segments, a reduction in incentives and a change in business model for certain delivery offerings in one of our markets[3]. Excluding the impact of the business model change, revenue growth would have been 255% YoY and 14% quarter-over-quarter (“QoQ”).
- Total GMV grew 11% YoY, or 20% YoY on a constant currency basis, primarily due to the continued recovery in Mobility and growth in Financial Services.
- Foreign exchange currency fluctuations impacted our results during the quarter. QoQ revenue grew 31% and GMV declined 2%, respectively, while on a constant currency basis, they grew by 36% and 2%, respectively.
- During the quarter, total incentives were further reduced to 8.2% of GMV, compared to 13.0% for the same period in 2021 and 9.4% for the previous quarter, demonstrating our continued focus on sustainable growth.
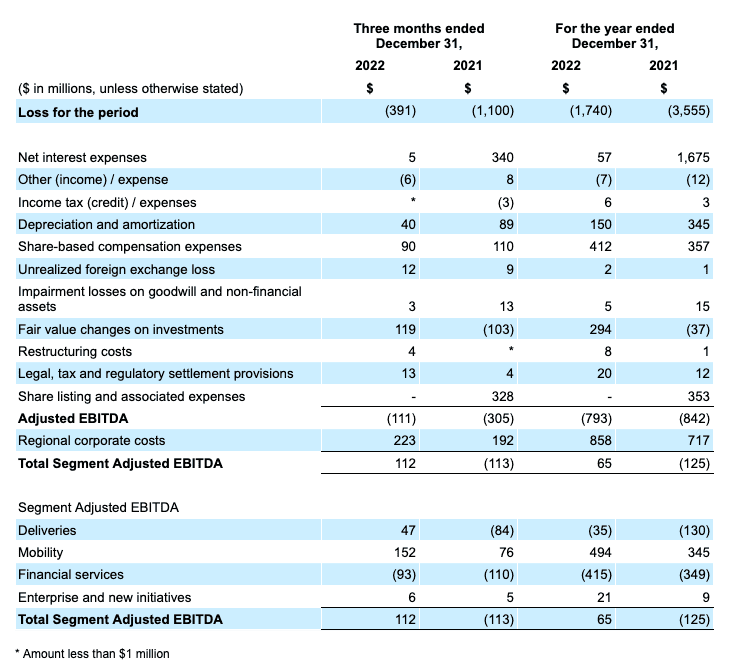
- Loss for the quarter was $391 million, a 64% improvement YoY, primarily due to the improvement in Group Adjusted EBITDA, with Total Segment Adjusted EBITDA turning profitable, and the elimination of the non-cash interest expense of Grab’s convertible redeemable preference shares that converted to ordinary shares in December 2021. Our loss for the quarter included a $119 million non-cash expense from fair value changes on investments, and $90 million in non-cash stock-based compensation expense.
- Group Adjusted EBITDA was negative $111 million for the quarter, an improvement of 63% compared to negative $305 million for the same period in 2021 as we continued to grow GMV while improving profitability on a Segment Adjusted EBITDA basis from lowered incentive spend.
- Group Adjusted EBITDA margin was (2.2)% for the quarter, an improvement from (6.8)% in the fourth quarter of 2021 and from (3.2)% in the third quarter of 2022.
- Regional corporate costs[4] for the quarter were $223 million, as compared to $192 million in the same period a year ago and $208 million in the prior quarter. On a YoY basis, regional corporate costs were relatively flat after excluding a non-recurring benefit recorded in the fourth quarter of 2021.
- The QoQ increase in regional corporate costs was predominantly driven by an increase in direct marketing costs due to seasonally higher spend in the fourth quarter amidst the festive period, and an increase in professional fees due to higher expenses associated with being a publicly-listed company, coupled with a one-off systems implementation cost to improve automation.
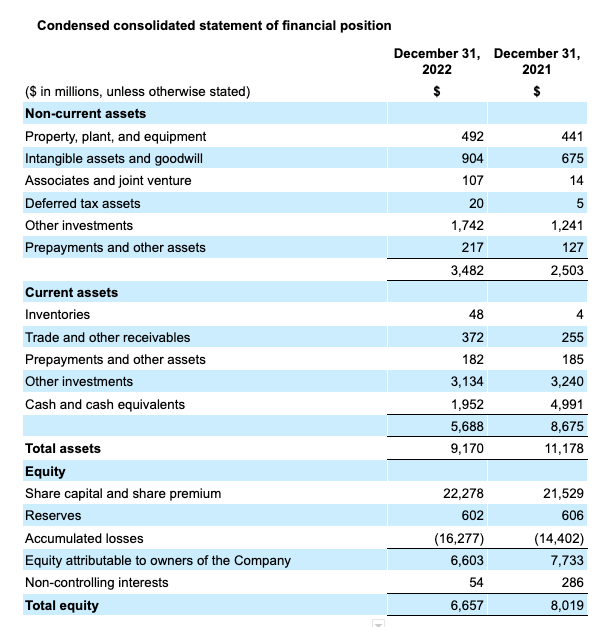
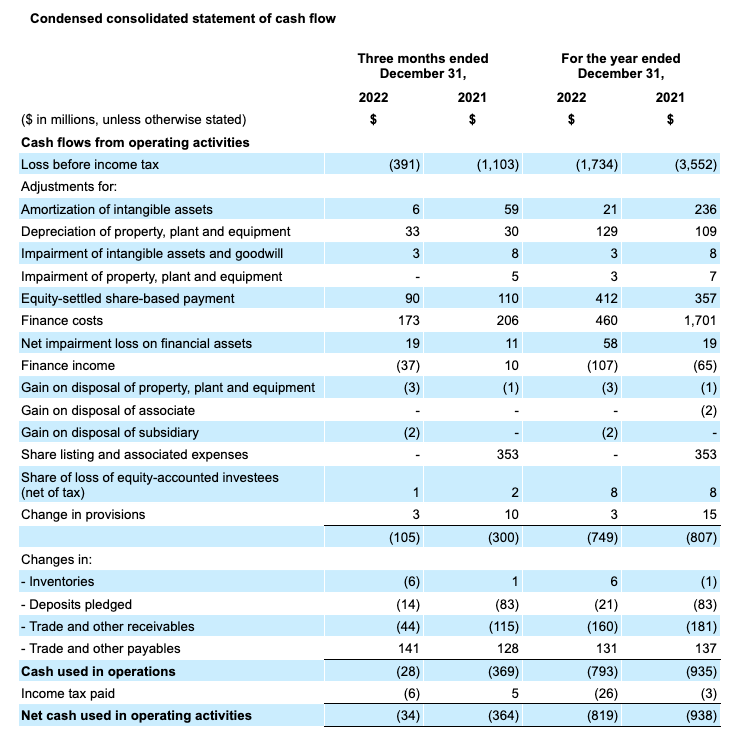
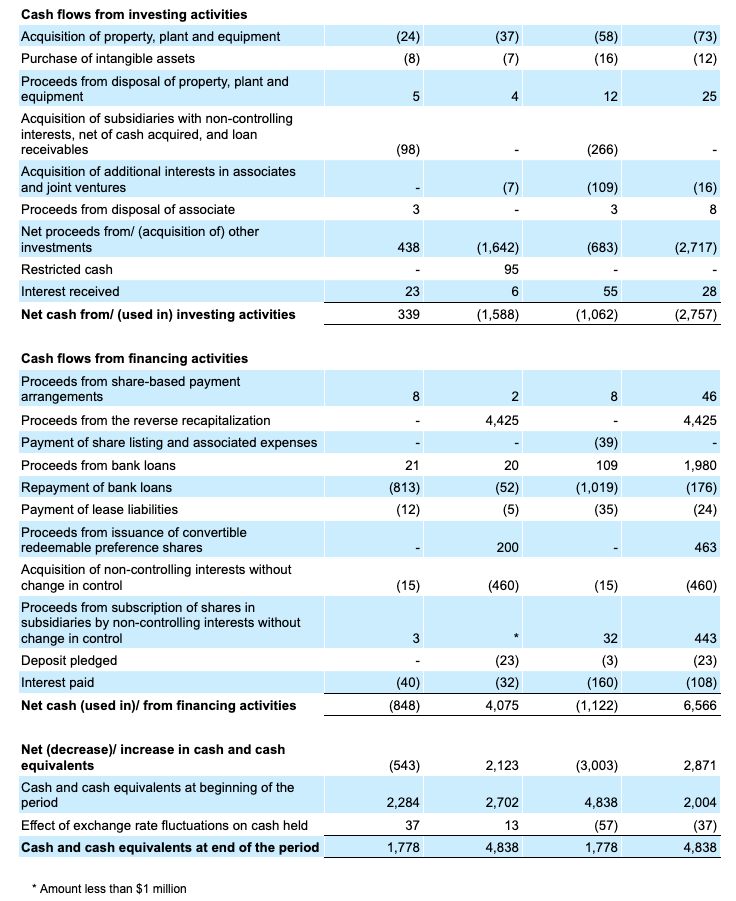
- Cash liquidity[5] totaled $6.5 billion at the end of the fourth quarter, compared to $7.4 billion at the end of the prior quarter, with a substantial part of the cash outflow attributed to the repurchase of our Term Loan B in the aggregate principal amount of $750 million for an aggregate consideration of $738 million completed in November 2022. Our net cash liquidity[6] was $5.1 billion at the end of the fourth quarter, as compared to $5.3 billion in the prior quarter. Amidst our focus to improve profitability and to preserve capital, the reduction in our net cash liquidity in H2 2022 was $430 million, and is 65% lower than the reduction in our net cash liquidity of $1,223 million in H1 2022.
- Leveraging the Grab ecosystem, we continue to attract more transacting users, while driving cross-sell rates, which in turn improves retention and engagement.
- Group MTUs grew 14% YoY in the fourth quarter, primarily driven by the continued recovery in Mobility MTUs.
- GMV per MTU declined by 2% in the fourth quarter compared to the same period of last year, but grew 6% on a constant currency basis.
- Grab continues to drive cross-vertical penetration rates, with 61% of MTUs using two or more offerings on the Grab platform in 2022, up from 56% in 2021.
- 74% of our two-wheel drivers[7] performed both food delivery and mobility jobs on the Grab platform, up from 67% in the fourth quarter 2021. On a full year basis, 71% of our two-wheel drivers7 performed both food delivery and mobility jobs on the Grab platform in 2022, up from 69% in 2021.
Group Full Year 2022 Key Operational and Financial Highlights
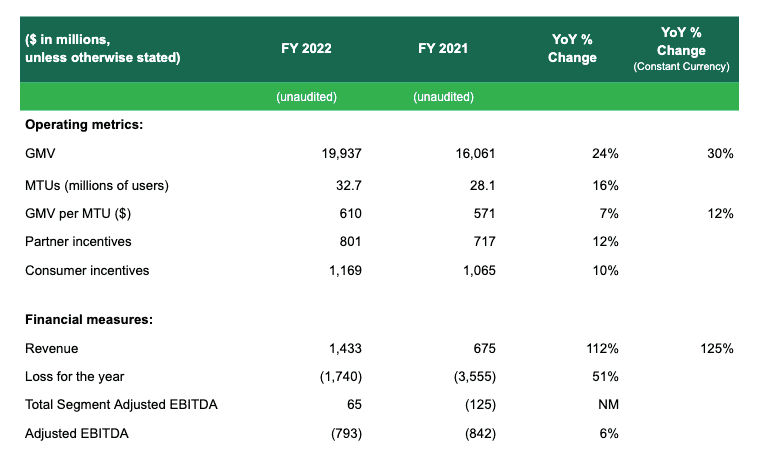
- Revenue for the full year grew 112% YoY, or 125% YoY on a constant currency basis, to $1,433 million. Excluding the $68 million uplift in revenues from the change in business model in certain Deliveries offerings in one of our markets, full year revenues would be $1,365 million, which exceeded our guidance range of $1,320 million to $1,350 million.
- Full year GMV was $19,937 million and grew 24% YoY, in line with our GMV growth guidance of 22% to 25% YoY. On a constant currency basis, GMV grew 30% YoY.
- Loss for the year was $1,740 million, a 51% improvement YoY, primarily due to the improvements in Adjusted EBITDA, with Total Segment Adjusted EBITDA turning profitable, and the elimination of the non-cash interest expense of Grab’s convertible redeemable preference shares that converted to ordinary shares in December 2021. Non-cash expenses included a $412 million expense in stock-based compensation expenses, $294 million in fair value changes on investments and $150 million of depreciation and amortization.
- Full year Adjusted EBITDA was negative $793 million, an improvement of 6% compared to negative $842 million for 2021. Adjusted EBITDA over the second half of 2022 was negative $272 million, above our guidance of negative $315 million.
Business Outlook
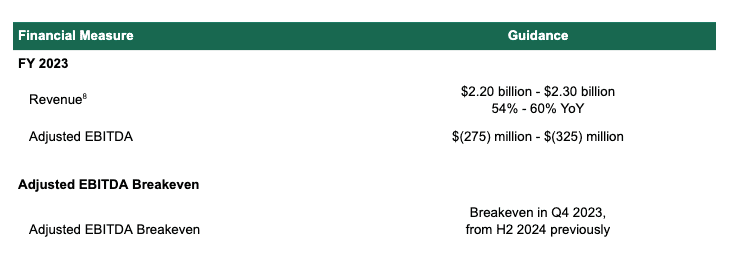
The guidance represents our expectations as of the date of this press release, and may be subject to change.
Segment Financial and Operational Highlights
Deliveries
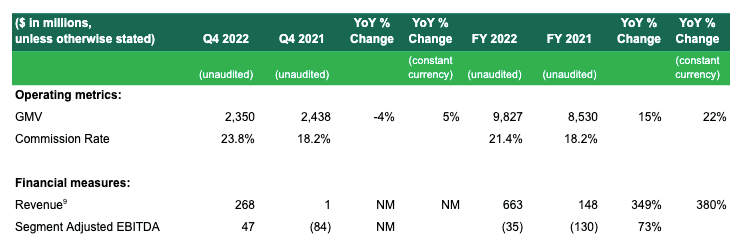
- Deliveries revenue grew to $268 million in the fourth quarter 2022 from $1 million in the same period in 2021, and by 349% YoY for the full year 2022. The strong growth was primarily attributed to contributions from Jaya Grocer, a reduction in incentives as a percentage of GMV, coupled with the change in business model of certain Deliveries offerings in one of our markets[9].
- Commission rate for the quarter rose to 23.8%, up from 18.2% for the same period in 2021, and on a full year basis, rose to 21.4% from 18.2% in the prior year. The increase was primarily driven by contributions from Jaya Grocer and the change in business model of certain Deliveries offerings in one of our markets.
- Fourth quarter 2022 Deliveries GMV declined 4% YoY, but grew 5% YoY on a constant currency basis. On a full year basis, Deliveries GMV grew 15% YoY, or 22% YoY on a constant currency basis.
- Deliveries segment adjusted EBITDA as a percentage of GMV expanded to 2.0% in the fourth quarter of 2022 from negative 3.5% in the same period in 2021 and after achieving breakeven in the prior quarter. For full year 2022, Deliveries segment adjusted EBITDA improved by 73% YoY.
- In the fourth quarter of 2022, the majority of our six core markets were profitable on a Deliveries segment adjusted EBITDA basis and in those respective markets, Deliveries segment adjusted EBITDA as a percentage of GMV were nearing or exceeding 3%.
Mobility
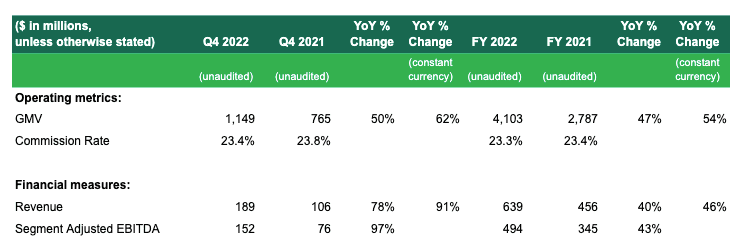
- Mobility revenues grew strongly and rose 78% YoY, or 91% YoY on a constant currency basis, in the fourth quarter 2022, and grew by 40% YoY, or 46% YoY on a constant currency basis, for the full year 2022. The strong YoY growth in Mobility was underpinned by the continued demand recovery amidst the reopening, which drove a normalization in local commutes and increase in airport rides, and our efforts to improve supply across the region.
- Commission rate for the quarter was 23.4% from 23.8% for the same period in 2021, and on a full year basis, was 23.3% from 23.4% for the same period in 2021.
- Mobility GMV was up 50% YoY, or 62% YoY on a constant currency basis, in the fourth quarter and grew 47% YoY, or 54% YoY on a constant currency basis, on a full year basis.
- Mobility segment adjusted EBITDA as a percentage of GMV was 13.2% in the fourth quarter of 2022 and 12.0% for full year 2022.
- During the quarter, we continued our focus on increasing active driver supply and optimizing our existing supply to cater to the strong demand recovery. We have re-launched GrabShare, our car-pooling service in the Philippines and Singapore, to provide more affordable Mobility options for our users, while optimizing driver supply.
Financial Services
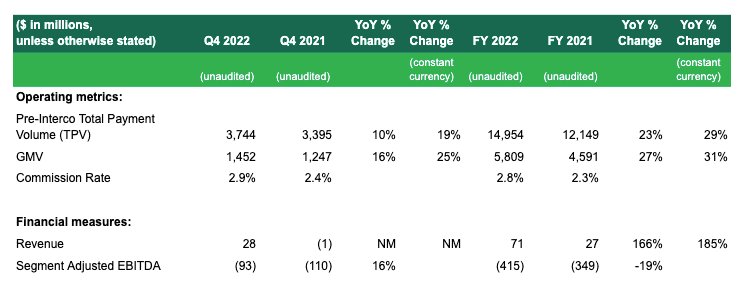
- Revenue for Financial Services grew to $28 million in the fourth quarter 2022, from negative $1 million in the same period in 2021, and by 166% YoY or 185% YoY on a constant currency basis for the full year 2022. The strong YoY growth was primarily attributed to higher contributions from our lending business, and lowered incentives as a percentage of GMV.
- Commission rate increased to 2.9% in the fourth quarter of 2022 from 2.4% in the same period in 2021, and to 2.8% in the full year 2022 from 2.3% in 2021. The increase in commission rates was primarily attributable to higher contributions from our lending business.
- GMV for Financial Services was up 16% YoY in the quarter, or 25% YoY on a constant currency basis, and by 27% YoY or 31% YoY on a constant currency basis for the full year.
- Segment adjusted EBITDA loss for the quarter improved 16% YoY, but declined 19% YoY for the full year, primarily attributed to higher expenses from Digibank operations. We have also continued to streamline our cost base in GrabFin, which declined by 4% YoY and 11% QoQ.
Enterprise and New Initiatives
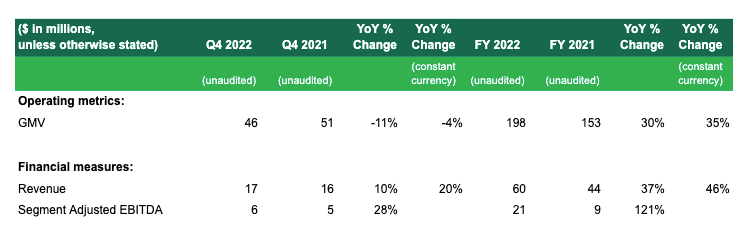
- Revenue from Enterprise and New Initiatives rose 10% YoY or 20% YoY on a constant currency basis for the fourth quarter 2022, and by 37% YoY, or 46% YoY on a constant currency basis for the full year 2022, mainly driven by growing contributions from our advertising services.
- GMV for the fourth quarter declined 11% YoY, or 4% YoY on a constant currency basis, attributed to our focus on driving profitable transactions. On a full year basis, GMV grew 30% YoY, or 35% YoY on a constant currency basis.
- Segment adjusted EBITDA grew 28% YoY in the quarter compared to the same period in 2021, and by 121% YoY for the full year, primarily attributed to lowered incentives as a percentage of GMV.
About Grab
Grab is a leading superapp in Southeast Asia, operating across the deliveries, mobility and digital financial services sectors. Serving over 500 cities in eight Southeast Asian countries – Cambodia, Indonesia, Malaysia, Myanmar, the Philippines, Singapore, Thailand and Vietnam – Grab is the regional category leader in food deliveries and mobility based on GMV in 2022, according to Euromonitor. Every day, Grab enables millions of people to order food or groceries, send packages, hail a ride or taxi, pay for online purchases or access services such as lending and insurance, all through a single app. Grab was founded in 2012 with the mission to drive Southeast Asia forward by creating economic empowerment for everyone, and strives to serve a triple bottom line: to simultaneously deliver financial performance for its shareholders and have a positive social and environmental impact in Southeast Asia.
Forward-Looking Statements
This document and the announced investor webcast contain “forward-looking statements” within the meaning of the “safe harbor” provisions of the U.S. Private Securities Litigation Reform Act of 1995. All statements other than statements of historical fact contained in this document and the webcast, including but not limited to, statements about Grab’s goals, targets, projections, outlooks, beliefs, expectations, strategy, plans, objectives of management for future operations of Grab, and growth opportunities, are forward-looking statements. Some of these forward-looking statements can be identified by the use of forward-looking words, including “anticipate,” “expect,” “suggest,” “plan,” “believe,” “intend,” “estimate,” “target,” “project,” “should,” “could,” “would,” “may,” “will,” “forecast” or other similar expressions. Forward-looking statements are based upon estimates and forecasts and reflect the views, assumptions, expectations, and opinions of Grab, which involve inherent risks and uncertainties, and therefore should not be relied upon as being necessarily indicative of future results. A number of factors, including macro-economic, industry, business, regulatory and other risks, could cause actual results to differ materially from those contained in any forward-looking statement, including but not limited to: Grab’s ability to grow at the desired rate or scale and its ability to manage its growth; its ability to further develop its business, including new products and services; its ability to attract and retain partners and consumers; its ability to compete effectively in the intensely competitive and constantly changing market; its ability to continue to raise sufficient capital; its ability to reduce net losses and the use of partner and consumer incentives, and to achieve profitability; potential impact of the complex legal and regulatory environment on its business; its ability to protect and maintain its brand and reputation; general economic conditions, in particular as a result of COVID-19, currency exchange fluctuations and inflation; expected growth of markets in which Grab operates or may operate; and its ability to defend any legal or governmental proceedings instituted against it. In addition to the foregoing factors, you should also carefully consider the other risks and uncertainties described in the “Risk Factors” section of Grab’s registration statement on Form F-1 and the prospectus therein, and other documents filed by Grab from time to time with the U.S. Securities and Exchange Commission (the “SEC”).
Forward-looking statements speak only as of the date they are made. Grab does not undertake any obligation to update any forward-looking statement, whether as a result of new information, future developments, or otherwise, except as required under applicable law.
Unaudited Financial Information
Grab’s unaudited selected financial data for the three months and twelve months ended December 31, 2022 and 2021 included in this document and the investor webcast is based on financial data derived from the Grab’s management accounts that have not been reviewed or audited.
Non-IFRS Financial Measures
This document and the investor webcast include references to non-IFRS financial measures, which include: Adjusted EBITDA, Segment Adjusted EBITDA, Total Segment Adjusted EBITDA and Adjusted EBITDA margin. Grab uses these non-IFRS financial measures for financial and operational decision-making and as a means to evaluate period-to-period comparisons, and Grab’s management believes that these non-IFRS financial measures provide meaningful supplemental information regarding its performance by excluding certain items that may not be indicative of its recurring core business operating results. For example, Grab’s management uses: Total Segment Adjusted EBITDA as a useful indicator of the economics of Grab’s business segments, as it does not include regional corporate costs. However, there are a number of limitations related to the use of non-IFRS financial measures, and as such, the presentation of these non-IFRS financial measures should not be considered in isolation from, or as an alternative to, financial measures determined in accordance with IFRS. In addition, these non-IFRS financial measures may differ from non-IFRS financial measures with comparable names used by other companies. See below for additional explanations about the non-IFRS financial measures, including their definitions and a reconciliation of these measures to the most directly comparable IFRS financial measures. With regard to forward-looking non-IFRS guidance and targets provided in this document and the investor webcast, Grab is unable to provide a reconciliation of these forward-looking non-IFRS measures to the most directly comparable IFRS measures without unreasonable efforts because the information needed to reconcile these measures is dependent on future events, many of which Grab is unable to control or predict.
Explanation of non-IFRS financial measures:
- Adjusted EBITDA is a non-IFRS financial measure calculated as net loss adjusted to exclude: (i) interest income (expenses), (ii) other income (expenses), (iii) income tax expenses (credit), (iv) depreciation and amortization, (v) share-based compensation expenses, (vi) costs related to mergers and acquisitions, (vii) unrealized foreign exchange gain (loss), (viii) impairment losses on goodwill and non-financial assets, (ix) fair value changes on investments, (x) restructuring costs, (xi) legal, tax and regulatory settlement provisions and (xii) share listing and associated expenses.
- Segment Adjusted EBITDA is a non-IFRS financial measure, representing the Adjusted EBITDA of each of our four business segments, excluding, in each case, regional corporate costs.
- Total Segment Adjusted EBITDA is a non-IFRS financial measure, representing the sum of Adjusted EBITDA of our four business segments.
- Adjusted EBITDA margin is a non-IFRS financial measure calculated as Adjusted EBITDA divided by Gross Merchandise Value.
This document and the investor webcast also includes “Pre-InterCo” data that does not reflect elimination of intragroup transactions, which means such data includes earnings and other amounts from transactions between entities within the Grab group that are eliminated upon consolidation. Such data differs materially from the corresponding figures post-elimination of intra-group transactions.
We compare the percent change in our current period results from the corresponding prior period using constant currency. We present constant currency growth rate information to provide a framework for assessing how our underlying GMV and revenue performed excluding the effect of foreign currency rate fluctuations. We calculate constant currency by translating our current period financial results using the corresponding prior period’s monthly exchange rates for our transacted currencies other than the U.S. dollar.
Operating Metrics
Gross Merchandise Value (GMV) is an operating metric representing the sum of the total dollar value of transactions from Grab’s services, including any applicable taxes, tips, tolls and fees, over the period of measurement. GMV is a metric by which Grab understands, evaluates and manages its business, and Grab’s management believes is necessary for investors to understand and evaluate its business. GMV provides useful information to investors as it represents the amount of a consumer’s spend that is being directed through Grab’s platform. This metric enables Grab and investors to understand, evaluate and compare the total amount of customer spending that is being directed through its platform over a period of time. Grab presents GMV as a metric to understand and compare, and to enable investors to understand and compare, Grab’s aggregate operating results, which captures significant trends in its business over time.
Total Payments Volume (TPV) means total payments volume received from consumers, which is an operating metric defined as the value of payments, net of payment reversals, successfully completed through our platform.
Monthly Transacting User (MTUs) is defined as the monthly transacting users, which is an operating metric defined as the monthly number of unique users who transact via Grab’s products, where transact means to have successfully paid for any of Grab’s products. MTUs is a metric by which Grab understands, evaluates and manages its business, and Grab’s management believes is necessary for investors to understand and evaluate its business.
Commission rate represents the total dollar value paid to Grab in the form of commissions and fees from each transaction, without any adjustments for incentives paid to driver- and merchant-partners or promotions to end-users, as a percentage of GMV, over the period of measurement.
Partner incentives is an operating metric representing the dollar value of incentives granted to driver- and merchant-partners. The incentives granted to driver- and merchant-partners include base incentives and excess incentives, with base incentives being the amount of incentives paid to driver- and merchant-partners up to the amount of commissions and fees earned by Grab from those driver- and merchant-partners, and excess incentives being the amount of payments made to driver- and merchant-partners that exceed the amount of commissions and fees earned by Grab from those driver- and merchant-partners.
Consumer incentives is an operating metric representing the dollar value of discounts and promotions offered to consumers. Partner incentives and consumer incentives are metrics by which we understand, evaluate and manage our business, and we believe are necessary for investors to understand and evaluate our business. We believe these metrics capture significant trends in our business over time.
Industry and Market Data
This document also contains information, estimates and other statistical data derived from third party sources (including Euromonitor), including research, surveys or studies, some of which are preliminary drafts, conducted by third parties, information provided by customers and/or industry or general publications. Such information involves a number of assumptions and limitations and due to the nature of the techniques and methodologies used in market research, and as such neither Grab nor the third-party sources (including Euromonitor) can guarantee the accuracy of such information. You are cautioned not to give undue weight on such estimates. Grab has not independently verified such third-party information, and makes no representation as to the accuracy of such third-party information.
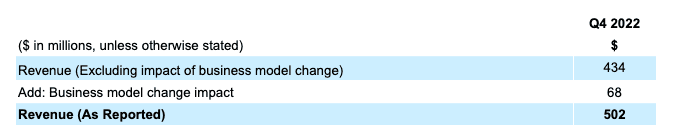
Business Model Change Impact on Group Revenue
Deliveries and Group Revenues benefited by $68 million in Q4 2022 due to a business model change for certain delivery offerings in one of our markets from being an agent arranging for delivery services to be provided by our driver-partners to end-users, to being a principal whereby Grab is the delivery service provider contractually responsible for the delivery services provided to end-users. Revenue from these transactions is the amount of the delivery fees paid by end users for the delivery service, and the amount paid to driver-partners to carry out the delivery is recognised as an expense under cost of revenue. Revenues, excluding the impact of business model change, would have been $434 million in Q4 2022.
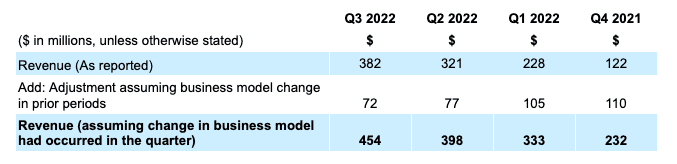
This business model change is a prospective change starting from and including Q4 2022. For reference purposes only, if the change in business model had occurred with effect from Q4 2021, we estimate the impact on revenue for the previous four quarters to be as follows.
Unaudited Summary of Financial Results
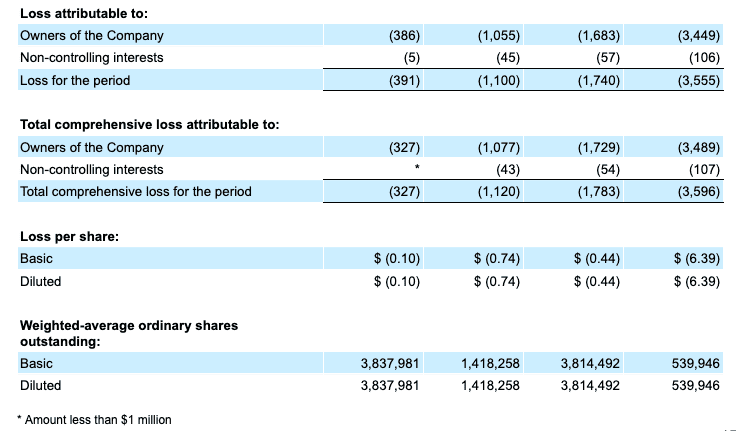
As we incurred net losses for the years ended December 31, 2022 and 2021, basic loss per share was the same as diluted loss per share.
The number of outstanding Class A and Class B ordinary shares was 3,736 million and 104 million, respectively, for the year ended December 31, 2022, and 3,619 million and 90 million, respectively, for the year ended December 31, 2021. 314 million and 224 million potentially dilutive outstanding securities were excluded from the computation of diluted loss per ordinary share because their effects would have been antidilutive for the years ended December 31, 2022 and 2021, respectively, or issuance of such shares is contingent upon the satisfaction of certain conditions which were not satisfied by the end of the period.

[1]Deliveries Revenues benefited by $68 million in Q4 2022 due to a business model change for certain delivery offerings in one of our markets from being an agent arranging for delivery services provided by our driver-partners to end-users, to being a principal whereby Grab is the delivery service provider contractually responsible for the delivery services provided to end-users. Excluding the change in business model, Q4 2022 and FY 2022 revenue growth would have been 255% YoY and 102% YoY, respectively. We expect this new business model to remain in place for those delivery offerings in that market going forward. On a constant currency basis and excluding the change in business model, we estimate revenue growth in 2023 to be 45% to 55%.
[2] We calculate constant currency by translating our current period financial results using the corresponding prior period’s monthly exchange rates for our transacted currencies other than the U.S. dollar.
[3] Deliveries revenues benefited by $68 million in Q4 2022 due to a business model change for certain delivery offerings in one of our markets from being an agent arranging for delivery services provided by our driver-partners to end-users, to being a principal whereby Grab is the delivery service provider contractually responsible for the delivery services provided to end-users.
[4] Regional corporate costs are costs that are not attributed to any of the business segments, including certain regional research and development expenses, general and administrative expenses and marketing expenses. These regional research and development expenses also include mapping and payment technologies and support and development of the internal technology infrastructure. These general and administrative expenses also include certain shared costs such as finance, accounting, tax, human resources, technology and legal costs. Regional corporate costs exclude share-based compensation expenses.
[5] Cash liquidity includes cash on hand, time deposits, marketable securities and restricted cash.
[6] Net cash liquidity includes cash liquidity less loans and borrowings.
[7] Based on Indonesia, Vietnam and Thailand driver base.
[8] Deliveries Revenues benefited by $68 million in Q4 2022 due to a business model change for certain delivery offerings in one of our markets from being an agent arranging for delivery services provided by our driver-partners to end-users, to being a principal whereby Grab is the delivery service provider contractually responsible for the delivery services provided to end-users. We expect this new business model to remain in place for those delivery offerings in that market going forward. On a constant currency basis and excluding the change in business model, we estimate revenue growth in 2023 to be 45% to 55%.
[9] Deliveries revenues benefited by $68 million in Q4 2022 due to a business model change for certain delivery offerings in one of our markets from being an agent arranging for delivery services provided by our driver-partners to end-users, to being a principal whereby Grab is the delivery service provider contractually responsible for the delivery services provided to end-users.