Grab Reports Fourth Quarter and Full Year 2021 Results
Grab today announced financial results for the fourth quarter and full year ended December 31, 2021.

- Strong end to 2021 with another record quarter and year in Gross Merchandise Value (“GMV”), exceeding the high end of full year 2021 guidance range
- 2021 GMV grew 29% year-over-year (“YoY”) to $16.1 billion, and Q4 GMV grew 26% YoY to $4.5 billion
- Deliveries continues to outperform with GMV growing 56% YoY in 2021, and 52% YoY in Q4
- Mobility on the road to recovery with 45% quarter-over-quarter (“QoQ”) GMV growth in Q4
- Grab retained regional category leadership in 2021 for online food delivery, ride-hailing and e-wallet payments; accounting for more than half of Southeast Asia’s total food delivery GMV
SINGAPORE – March 3, 2022 – Grab Holdings Limited (NASDAQ: GRAB), Southeast Asia’s leading superapp, today announced financial results for the fourth quarter and full year ended December 31, 2021.
“2021 was our strongest year yet, even as we faced tougher conditions with the Delta and Omicron variants. We achieved outsized growth in both GMV and Revenues while continuing to improve our Adjusted EBITDA margins year over year, demonstrating the resilience and growing relevance of the superapp,” said Anthony Tan, Group CEO and co-founder of Grab. “Southeast Asians are relying more and more on the Grab superapp for a multitude of daily needs. 56% of our users are now using two or more Grab services and the average user spend on our platform in 2021 grew 31% year over year. We expect 2022 to be another watershed year for Grab, as we get ready to launch our digibank in Singapore, and continue to pursue the massive opportunities in deliveries to outserve consumers with more options and better convenience.”
Peter Oey, Chief Financial Officer of Grab, added, “We maintained category leadership across all our core verticals with our food delivery business making up the majority of Southeast Asia’s online food delivery market. The superapp gives us significant advantages in capital efficiencies, while continuing to drive greater loyalty and retention among our users. We plan to be judicious and disciplined in allocating capital, as we double down on the long-term growth opportunities of our on-demand, advertising and financial services businesses. Our Segment Adjusted EBITDA margins for Fiscal Year 2021 have improved year over year across our three core segments, and we have best-in-class margins in mobility. We remain laser focused on our path to profitability and will continue to improve our unit economics.”Full Year 2021
Financial and Operational Highlights
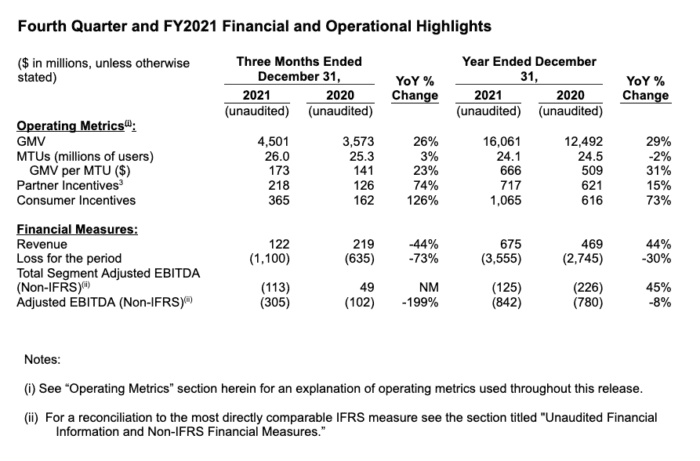
- GMV grew by 29% YoY to hit $16.1 billion, marking a record year for Grab. This exceeded the upper end of outlook provided in September 2021.
- Average Monthly Transacting Users (“MTUs”) for 2021 were 24.1 million, 2% lower YoY primarily due to severe lockdowns in Q3. However, Grab ended the year with 27.7 million MTUs in December 2021, higher than any other month in 2021 and reflecting strong bounce-back as movement restrictions eased.
- Average spend per user, defined as GMV per MTU, increased by 31% YoY to $666, reflecting greater loyalty and an increasingly entrenched user base.
- Deliveries and financial services outperformed expectations with 56% YoY growth in GMV and 37% YoY growth in Pre-Interco TPV respectively. This more than offset the 14% YoY drop in mobility GMV as the emergence of new variants slowed recovery.
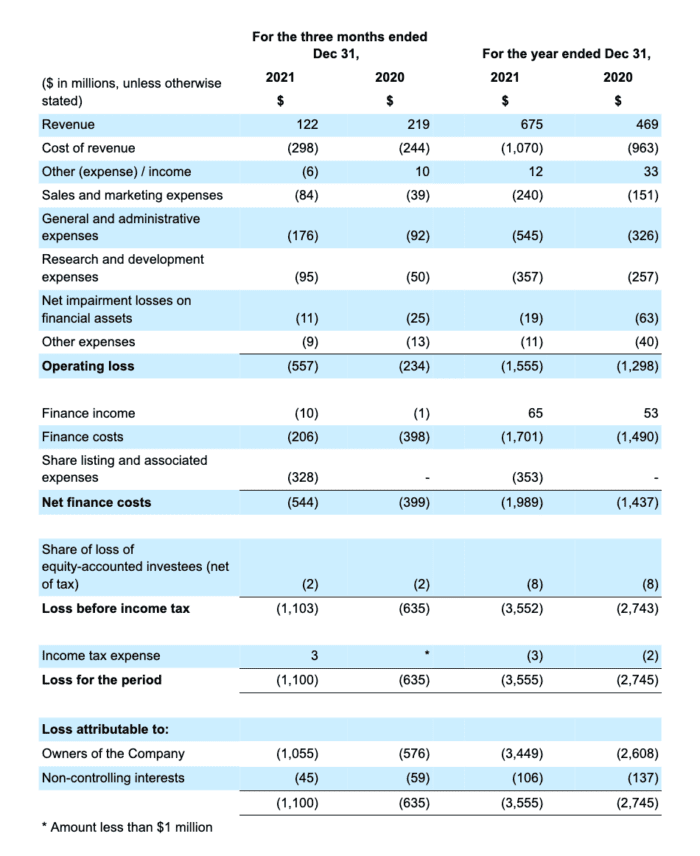
- Revenue increased by 44% YoY to $675 million off the back of strong growth in deliveries and financial services. Grab’s reported revenue is net of consumer, merchant and driver-partner incentives.
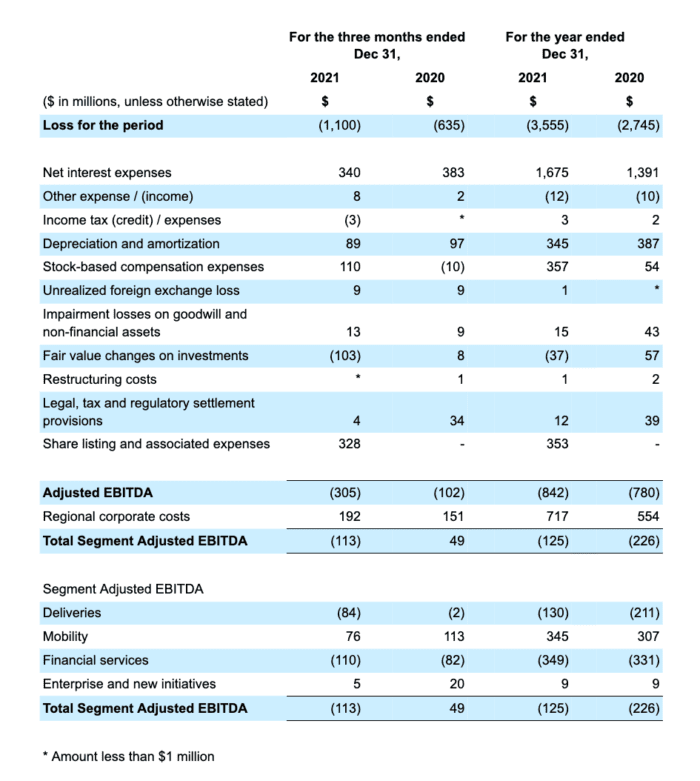
- Loss for 2021 was $3.6 billion, which includes $1.6 billion non-cash interest expense related to Grab’s convertible redeemable preference shares that ceased upon Grab’s public listing and $353 million in one-time public listing related expenses.
- Adjusted EBITDA of $(842) million met our guidance range. This was an 8% decline YoY. However, Adjusted EBITDA margins at (5.2)% of GMV improved compared to (6.2)% in 2020.
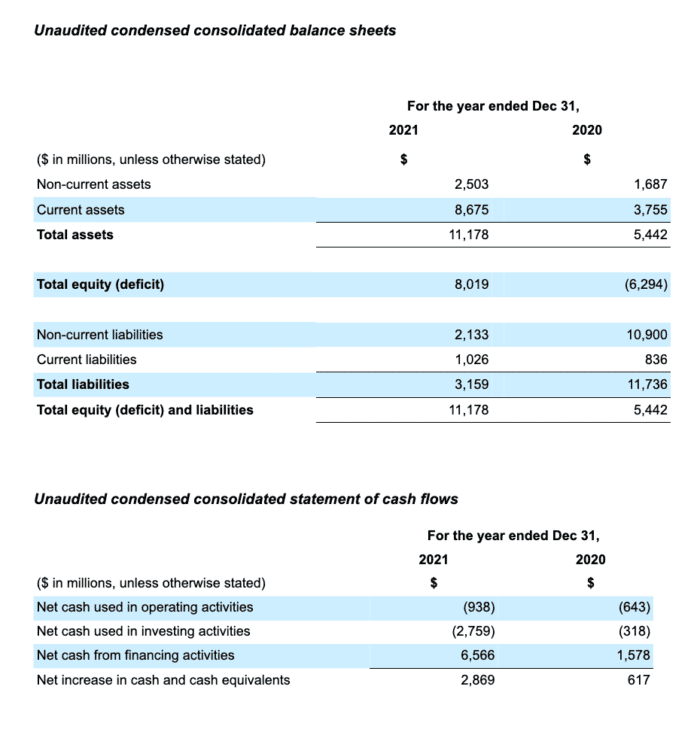
- Cash liquidity [1] totalled $9.0 billion at the end of the fourth quarter, while our net Cash liquidity [2] was $6.8 billion.
Fourth Quarter 2021 Financial and Operational Highlights
- GMV grew 26% YoY to reach $4.5 billion, marking four straight record quarters for Grab. Deliveries and financial services demonstrated strong YoY GMV and TPV (Pre-interco) growth of 52% and 29% respectively. Mobility GMV declined 11% YoY but continues to recover with 45% QoQ growth.
- MTUs grew by 3% YoY and 18% QoQ to 26.0 million as lockdowns continued to ease, the highest since COVID-19 related movement restrictions came into force in Q2 2020.
- Average spend per user increased by 23% YoY to $173.
- Revenue was $122 million, a 44% decline YoY as Grab preemptively invested to grow driver supply to support strong recovery in mobility demand. Consumer incentives for mobility and deliveries also increased as Grab invested in its category share and MTU growth.
- Loss for the period was $1.1 billion which included $311 million non-cash interest expense related to Grab’s convertible redeemable preference shares that ceased upon Grab’s public listing and $328 million related to one-time public listing related expenses, of which $290 million is non-cash.
- Adjusted EBITDA of $(305) million was down by $203 million YoY. Adjusted EBITDA margins were (6.8)% of GMV compared to (2.8)% in Q4 2020. The decline is a result of the increased investments in incentives stated above, and strategic investments in areas such as tech and financial services, including the digibank as we prepare for its launch in Singapore.
Results by Segments
Deliveries
- GMV for 2021 was $8.5 billion, a 56% increase YoY. Q4 deliveries GMV grew 52% YoY to hit a record high of $2.4 billion.
- Deliveries commission rate [4] for 2021 was 18.2%, an increase from 16.6% in 2020, and average order values for deliveries increased by 41% in 2021, compared to 2019, before COVID-19.
- Revenue for 2021 was $148 million, up from $5 million in 2020. Q4 Revenue for deliveries declined 98% YoY to $1 million as Grab invested in incentives to maintain its category leadership and to grow adoption of new services. Grab grew category share for food delivery in 2021 compared to 2020, while driving greater efficiencies from incentive investment. For example, on a per order basis, across competitive markets such as Indonesia, Malaysia, Thailand, and Vietnam, we estimate that our GMV to cost ratios [5] are 25% to almost 100% more efficient than competitor averages.
- Deliveries Segment Adjusted EBITDA of $(130) million for 2021 represented a margin of (1.5%) as a percentage of GMV, an improvement from (3.9%) in 2020. Q4 deliveries Segment Adjusted EBITDA was $(84) million.
- Euromonitor expects online penetration for grocery delivery to more than double between 2020 and 2025. Grab is doubling down on this space, and in January 2022, completed its acquisition of a majority stake in Jaya Grocer, a profitable and leading mass-premium supermarket chain in Malaysia with 44 stores. Both companies will partner to make on-demand groceries more accessible to Malaysian consumers. All Jaya Grocer stores will also adopt GrabPay and GrabRewards.
- Grab has also appointed Hardy Cao as its new Head of Supermarkets. Cao is a retail industry veteran with more than two decades of experience. His prior roles include the Chief Operating Officer of Hema in China and President of Carrefour China South Territory as well as Vice President of Carrefour China.
- Grab also continues to forge multi-vertical partnerships across payments, rewards, deliveries and ads with leading global brands. In Q4, Grab announced an expanded partnership with McDonald’s to transform the quick service restaurant experience in Singapore. Grab and Starbucks will also partner across multiple verticals to enhance the Starbucks Experience for customers in Southeast Asia.
Mobility
- GMV for 2021 was $2.8 billion, down by 14% YoY. Q4 GMV for mobility increased by 45% QoQ (11% decline YoY) to $765 million, on the back of strong recovery in ride-hailing demand as countries continue to cautiously reopen.
- Mobility Commission Rate for 2021 was 23.4%, an increase from 21.3% in 2020.
- Revenue for 2021 grew 4% YoY to $456 million. Mobility Revenue for Q4 was $105 million, down 27% YoY as Grab invested in driver incentives to bolster driver supply to capture strong recovery. Mobility consumer incentive levels also increased in certain markets as investments made in category leadership. In Singapore for example, Grab retained a comfortable lead in category share for Mobility and estimates it spent 4x less on promotions per ride in Q4 than a competitor [6].
- Segment Adjusted EBITDA for 2021 of $345 million was a margin of 12.4% on GMV for 2021, which improved from 9.5% in 2020. Mobility Segment Adjusted EBITDA for Q4 was $76 million, a 32% decrease compared to Q4 2020. The decline was likewise due to the investments made in higher driver incentives to meet demand bounceback from lockdowns reopening and maintaining category share.
Financial Services
- Total Payments Volume (Pre-InterCo) for 2021 was $12.1 billion, a 37% increase YoY. Pre-InterCo TPV for Q4 increased by 29% YoY to $3.4 billion, another record quarter for Grab’s financial services segment on a TPV basis.
- Commission Rate for 2021 was 2.3%, an increase from 1.9% in 2020.
- Revenue for 2021 grew by $37 million YoY to $27 million. Financial services Revenue for Q4 was $(1) million, a $3 million improvement YoY.
- Segment Adjusted EBITDA of $(349) million for 2021 represented a margin of (2.9%) of TPV, which was an improvement from (3.7%) in 2020. Financial services Segment Adjusted EBITDA for Q4 was $(110) million, compared to $(82) million in Q4 2020. The decline was due to investments in preparation for digibank launch in Singapore.
- TPV for Buy Now Pay Later has grown 5x between Q4 2020 and Q4 2021. Since its launch in late 2020, off-platform Buy Now Pay Later has seen strong uptake and results. Currently available in Singapore and Malaysia, Grab plans to launch the service in additional markets in 2022.
- Grab continues to invest in digibank opportunities in key markets. The Grab-Singtel digibank joint venture is ramping up operations and getting ready to launch in Singapore in 2022. Separately, Grab and a consortium of partners have applied for a digibank license in Malaysia. Grab also recently completed an acquisition of a 16.26% stake in Bank Fama in Indonesia.
Enterprise and New Initiatives
- Enterprise and new initiatives GMV in 2021 grew 248% YoY to $153 million. Q4 GMV for enterprise and new initiatives grew 127% YoY to $51 million. Grab’s advertising business saw its GMV grow by 189% YoY in Q4.
- Revenue for enterprise and new initiatives for 2021 increased by 22% YoY to $44 million. Revenue for the segment in Q4 declined by 39% YoY to $16 million.
- Segment Adjusted EBITDA for 2021 was $9.3 million or 6% of GMV, compared to 21% of GMV in 2020. Q4 enterprise and new initiatives Segment Adjusted EBITDA was $5 million, down $15 million YoY as continued investments were made in Grab’s Advertising business to expand its merchant base. Between Q4 2020 and Q4 2021, the number of merchants using Grab Marketing Services have more than tripled.
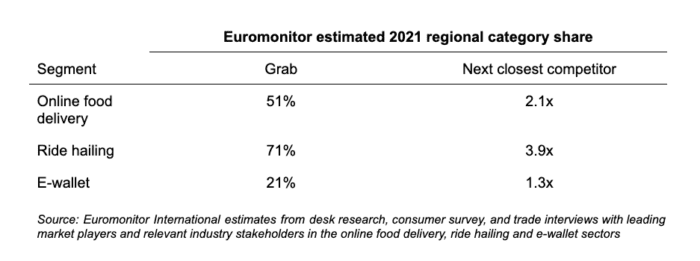
Grab remains category leader in Southeast Asia for online food delivery, ride-hailing and e-wallet payments
Euromonitor has updated its analysis for the full year of 2021 to determine category share across Grab’s three core business verticals: deliveries, mobility and financial services. Based on Euromonitor’s independent analysis, Grab continued to be the category leader in 2021 by GMV in online food delivery and ride-hailing, and by TPV in the e-wallet segment of financial services in Southeast Asia, despite increased competition. Notably, Euromonitor found that Grab continues to be the leading ride-hailing and food delivery platform in Indonesia.
According to data.ai (formerly known as App Annie), Grab led the mobility and delivery category in 2021 for Southeast Asia with the highest number of average monthly active users and downloads [7], being 2.2x and 1.2x larger respectively compared to the next closest competitor.
Company Outlook
Coming off Q4 which is a seasonally strong quarter, for Q1 2022 Grab currently expects:
- Deliveries GMV to be between $2.4 billion to $2.5 billion
- Mobility GMV to be between $0.75 billion to $0.80 billion
- Financial Services Pre-InterCo TPV to be between $3.1 billion to $3.2 billion
Grab further expects GMV growth for each of the quarters from Q2 to Q4 2022 to accelerate to 30 – 35% YoY, subject to shifts in the COVID-19 environment.
Looking beyond 2022, Grab is progressing towards core food delivery Segment Adjusted EBITDA breakeven by the first half of 2023 and deliveries Segment Adjusted EBITDA breakeven by the end of 2023. In the long term, Grab is targeting steady state Adjusted EBITDA to GMV margins of 12% in mobility and 3% in deliveries.
Footnotes
[1] Cash liquidity includes cash on hand, time deposits, marketable securities and restricted cash.
[2] Net cash liquidity includes cash liquidity less loans and borrowings.
[3] Partner incentives were comprised of $40 million in base partner incentives and $178 million in excess partner incentives in the fourth quarter of 2021 in comparison with $31 million in base partner incentives and $95 million in excess partner incentives in the fourth quarter of 2020. Partner incentives were comprised of $155 million in base partner incentives and $561 million in excess partner incentives for the year ended December 31, 2021 in comparison with $178 million in base partner incentives and $443 million in excess partner incentives for the year ended December 31, 2020.
[4] Commission Rate is an operating metric, representing the total dollar value paid to Grab in the form of commissions and fees from each transaction, without any adjustments for incentives paid to driver- and merchant-partners or promotions to end-users, as a percentage of GMV, over the period of measurement.
[5] 1. Competitor’s data are calculated based on Grab’s internal estimates, leveraging observable promotions from publicly available sources and consumer survey panels. Competitor averages are calculated as a simple average of GMV to Cost per Order ratios for sizable and significant regional competitors that we monitor in each market. 2. Cost per order defined as Grab’s internally estimated (for competitors) and actual (for Grab) consumer incentives and merchant-funded subsidies.
[6] Competitor’s data are based on Grab’s internal estimates and based on observable promotions from publicly available sources and consumer survey panels.
[7] Downloads across iOS and Google Play, MAU across iPhones and Android phones combined; Southeast Asia defined as Indonesia, Singapore, Malaysia, Vietnam, Philippines, Thailand
About Grab
Grab is Southeast Asia’s leading superapp based on GMV in 2021 in each of food deliveries, mobility and the e-wallets segment of financial services, according to Euromonitor. Grab operates across the deliveries, mobility and digital financial services sectors in 480 cities in eight countries in the Southeast Asia region – Cambodia, Indonesia, Malaysia, Myanmar, the Philippines, Singapore, Thailand and Vietnam. Grab enables millions of people each day to access its driver- and merchant-partners to order food or groceries, send packages, hail a ride or taxi, pay for online purchases or access services such as lending, insurance, wealth management and telemedicine, all through a single “everyday everything” app. Grab was founded in 2012 with the mission to drive Southeast Asia forward by creating economic empowerment for everyone, and since then, the Grab app has been downloaded onto millions of mobile devices. Grab strives to serve a double bottom line: to simultaneously deliver financial performance for its shareholders and a positive social impact in Southeast Asia.
Contact Information
For inquiries regarding Grab, please contact:
Media
Grab: press@grab.com
Sard Verbinnen & Co: Grab-SVC@sardverb.com
Investors
Grab: investor.relations@grab.com
Forward-Looking Statements
This document and the announced investor webcast contain “forward-looking statements” within the meaning of the “safe harbor” provisions of the U.S. Private Securities Litigation Reform Act of 1995. All statements other than statements of historical fact contained in this document and the webcast, including but not limited to, statements about Grab’s beliefs and expectations, business strategy and plans, objectives of management for future operations of Grab, and growth opportunities, are forward-looking statements. Some of these forward-looking statements can be identified by the use of forward-looking words, including “anticipate,” “expect,” “suggest,” “plan,” “believe,” “intend,” “estimate,” “target,” “project,” “should,” “could,” “would,” “may,” “will,” “forecast” or other similar expressions. Forward-looking statements are based upon estimates and forecasts and reflect the views, assumptions, expectations, and opinions of Grab, which involve inherent risks and uncertainties, and therefore should not be relied upon as being necessarily indicative of future results. A number of factors could cause actual results to differ materially from those contained in any forward-looking statement, including but not limited to: Grab’s ability to grow at the desired rate or scale and its ability to manage its growth; its ability to further develop its business, including new products and services; its ability to attract and retain partners and consumers; its ability to compete effectively in the intensely competitive and constantly changing market; its ability to continue to raise sufficient capital; its ability to reduce net losses and the use of partner and consumer incentives, and to achieve profitability; potential impact of the complex legal and regulatory environment on its business; its ability to protect and maintain its brand and reputation; general economic conditions, in particular as a result of COVID-19; expected growth of markets in which Grab operates or may operate; and its ability to defend any legal or governmental proceedings instituted against it. In addition to the foregoing factors, you should also carefully consider the other risks and uncertainties described in the “Risk Factors” section of Grab’s registration statement on Form F-1 and the prospectus therein, and other documents filed by Grab from time to time with the U.S. Securities and Exchange Commission (the “SEC”).
Forward-looking statements speak only as of the date they are made. Grab does not undertake any obligation to update any forward-looking statement, whether as a result of new information, future developments, or otherwise, except as required under applicable law.
Unaudited Financial Information and Non-IFRS Financial Measures
Grab’s unaudited selected financial data for the three months and year ended December 31, 2021 and 2020 included in this document and the investor webcast is based on financial data derived from the Grab’s management accounts that have not been reviewed or audited.
This document and the investor webcast also include references to non-IFRS financial measures, which include: Adjusted EBITDA, Total Segment Adjusted EBITDA and Segment Adjusted EBITDA. However, the presentation of these non-IFRS financial measures is not intended to be considered in isolation from, or as an alternative to, financial measures determined in accordance with IFRS. In addition, these non-IFRS financial measures may differ from non-IFRS financial measures with comparable names used by other companies.
Grab uses these non-IFRS financial measures for financial and operational decision-making and as a means to evaluate period-to-period comparisons, and Grab’s management believes that these non-IFRS financial measures provide meaningful supplemental information regarding its performance by excluding certain items that may not be indicative of its recurring core business operating results. For example, Grab’s management uses: Total Segment Adjusted EBITDA as a useful indicator of the economics of Grab’s business segments, as it does not include regional corporate costs.
There are a number of limitations related to the use of non-IFRS financial measures. In light of these limitations, we provide specific information regarding the IFRS amounts excluded from these non-IFRS financial measures and evaluate these non-IFRS financial measures together with their relevant financial measures in accordance with IFRS.
This document and the investor webcast also includes “Pre-InterCo” data that does not reflect elimination of intragroup transactions, which means such data includes earnings and other amounts from transactions between entities within the Grab group that are eliminated upon consolidation. Such data differs materially from the corresponding figures post-elimination of intra-group transactions.
Explanation of non-IFRS financial measures:
- Adjusted EBITDA is a non-IFRS financial measure calculated as net loss adjusted to exclude: (i) interest income (expenses), (ii) other income (expenses), (iii) income tax expenses (credit), (iv) depreciation and amortization, (v) stock-based compensation expenses, (vi) costs related to mergers and acquisitions, (vii) unrealized foreign exchange gain (loss), (viii) impairment losses on goodwill and non-financial assets, (ix) fair value changes on investments, (x) restructuring costs, (xi) legal, tax and regulatory settlement provisions and (xii) share listing and associated expenses.
- Segment Adjusted EBITDA is a non-IFRS financial measure, representing the Adjusted EBITDA of each of our four business segments, excluding, in each case, regional corporate costs.
- Adjusted EBITDA margin is a non-IFRS financial measure calculated as Adjusted EBITDA divided by Gross Merchandise Value.
Operating Metrics
Gross Merchandise Value (GMV) is an operating metric representing the sum of the total dollar value of transactions from Grab’s services, including any applicable taxes, tips, tolls and fees, over the period of measurement. GMV is a metric by which Grab understands, evaluates and manages its business, and Grab’s management believes is necessary for investors to understand and evaluate its business. GMV provides useful information to investors as it represents the amount of a consumer’s spend that is being directed through Grab’s platform. This metric enables Grab and investors to understand, evaluate and compare the total amount of customer spending that is being directed through its platform over a period of time. Grab presents GMV as a metric to understand and compare, and to enable investors to understand and compare, Grab’s aggregate operating results, which captures significant trends in its business over time.
Monthly Transacting User (MTU) is defined as the monthly transacting users, which is an operating metric defined as the monthly number of unique users who transact via Grab’s products, where transact means to have successfully paid for any of Grab’s products. MTU is a metric by which Grab understands, evaluates and manages its business, and Grab’s management believes is necessary for investors to understand and evaluate its business.
Commission Rate represents the total dollar value paid to Grab in the form of commissions and fees from each transaction, without any adjustments for incentives paid to driver- and merchant-partners or promotions to end-users, as a percentage of GMV, over the period of measurement.
Partner incentives is an operating metric representing the dollar value of incentives granted to driver- and merchant-partners. The incentives granted to driver- and merchant-partners include base incentives and excess incentives, with base incentives being the amount of incentives paid to driver- and merchant-partners up to the amount of commissions and fees earned by Grab from those driver- and merchant-partners, and excess incentives being the amount of payments made to driver- and merchant-partners that exceed the amount of commissions and fees earned by Grab from those driver- and merchant-partners. Consumer incentives is an operating metric representing the dollar value of discounts and promotions offered to consumers. Partner incentives and consumer incentives are metrics by which we understand, evaluate and manage our business, and we believe are necessary for investors to understand and evaluate our business. We believe these metrics capture significant trends in our business over time.
Industry and Market Data
This document also contains information, estimates and other statistical data derived from third party sources, including research, surveys or studies, some of which are preliminary drafts, conducted by third parties, information provided by customers and/or industry or general publications. Such information involves a number of assumptions and limitations, and you are cautioned not to give undue weight on such estimates. Grab has not independently verified such third-party information, and makes no representation as to the accuracy of such third-party information.
Unaudited Summary of Financial Results
Unaudited condensed consolidated statement of operations